A quick summary of our Weftec 2019 presentation on EBPR design and operation
This year's Weftec I had limited time to attend lots of sessions unfortunately. As a compensation however, I could meet lots of incredible people. In this article series, we give you a small summary of what we've presented at Weftec from the AM-TEAM side. What follows was presented on Tuesday morning.
Talk 1: Better operation, design and modelling of EBPR by understanding mixing dynamics using advanced CFD with integrated BioP kinetics and simultaneous sludge settling
Authors: Usman Rehman*, Wim Audenaert*, Ingmar Nopens*, Leon Downing°, James Barnard°, Patrick Dunlap° (*AM-TEAM; °Black & Veatch)
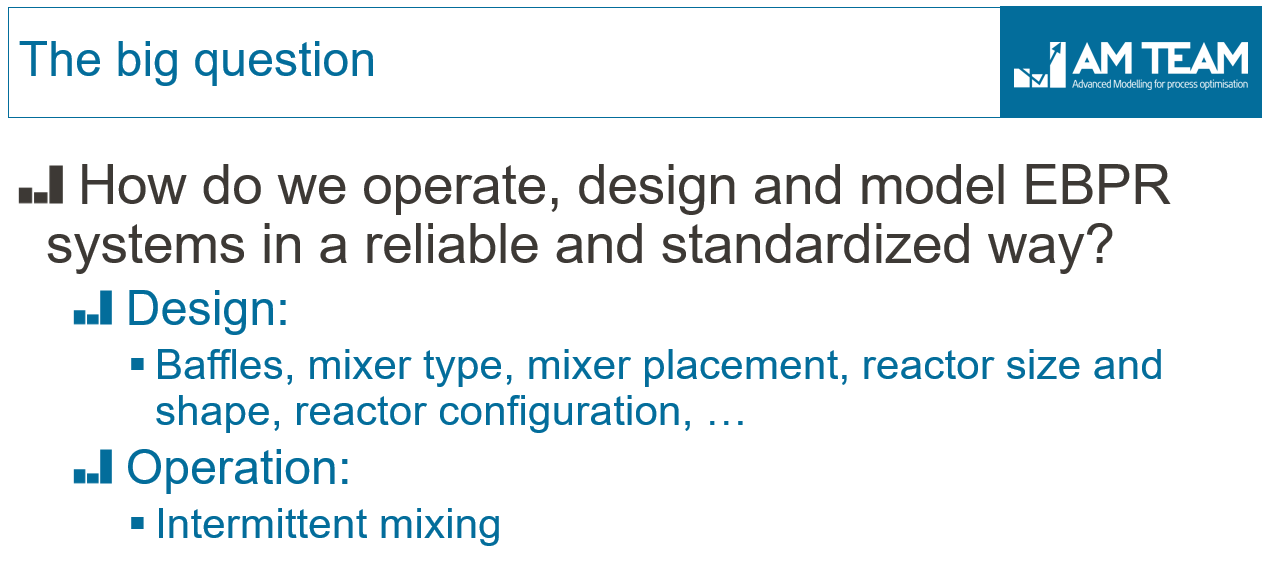
This case, with very short title, was established by a good collaboration between AM-TEAM and Black & Veatch. Enhanced Biological Phosphorous Removal (EBPR),a hot topic in the US, is one of the most debated processes: how should we design and operate these processes, and how can we standardise it? Standardisation is only possible if one knows what really happens. And this is what we wanted to shed light on. We wanted to look at the process from an angle no one else had tried. And it's probably a valuable one... We will use the tool established at multiple full-scale plants in the near future.
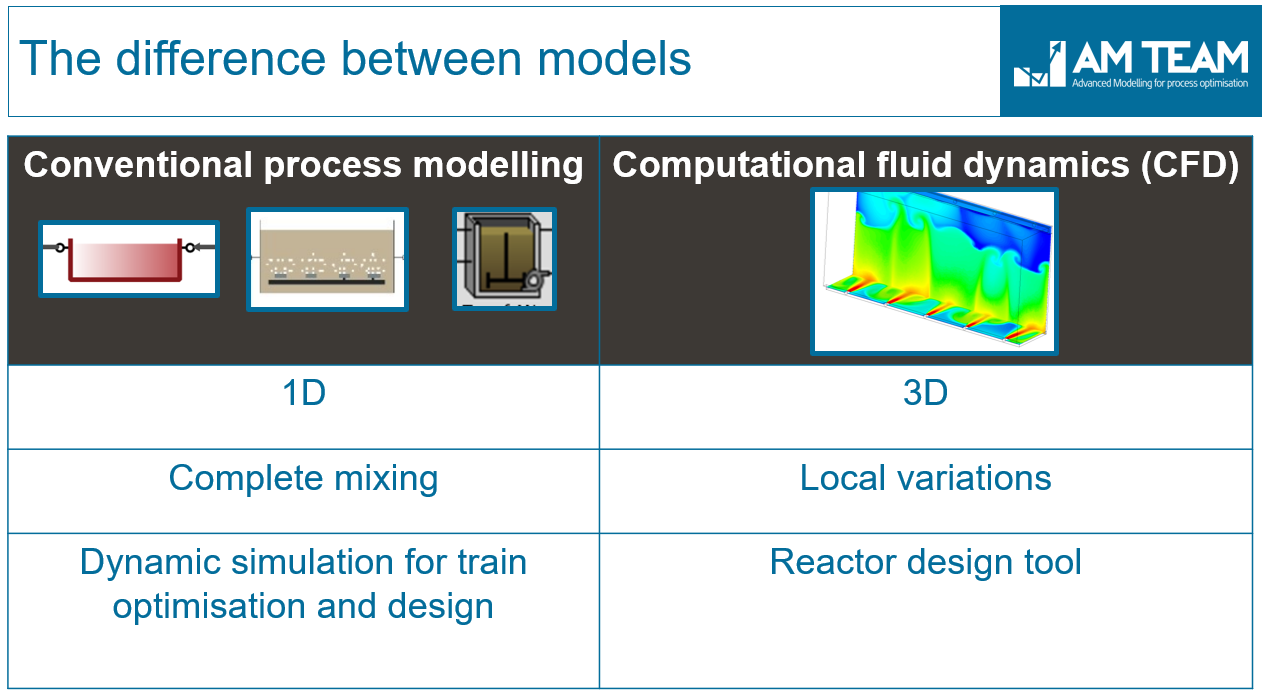
For the first time in history, we have coupled Computational Fluid Dynamics (CFD) with ASM2d, a model describing phosphorous removal kinetics. It includes the production of volatile fatty acids (VFAs) through different pathways. Such a model 'detects' the impact of changing a baffle, inlet location, etc., ... It is a powerful reactor design tool. While standard process simulation makes rough assumptions on mixing. It is however a powerful dynamic train design tool. So as a first goal of this talk, we wanted to stress these differences in nature and application. In this study, our partners used GPS-X. However, you can use different simulation platforms such as SUMO, BioWin, SIMBA, West, ... SO THE OUTCOMES ARE PROCESS SIMULATOR NON-SPECIFIC!
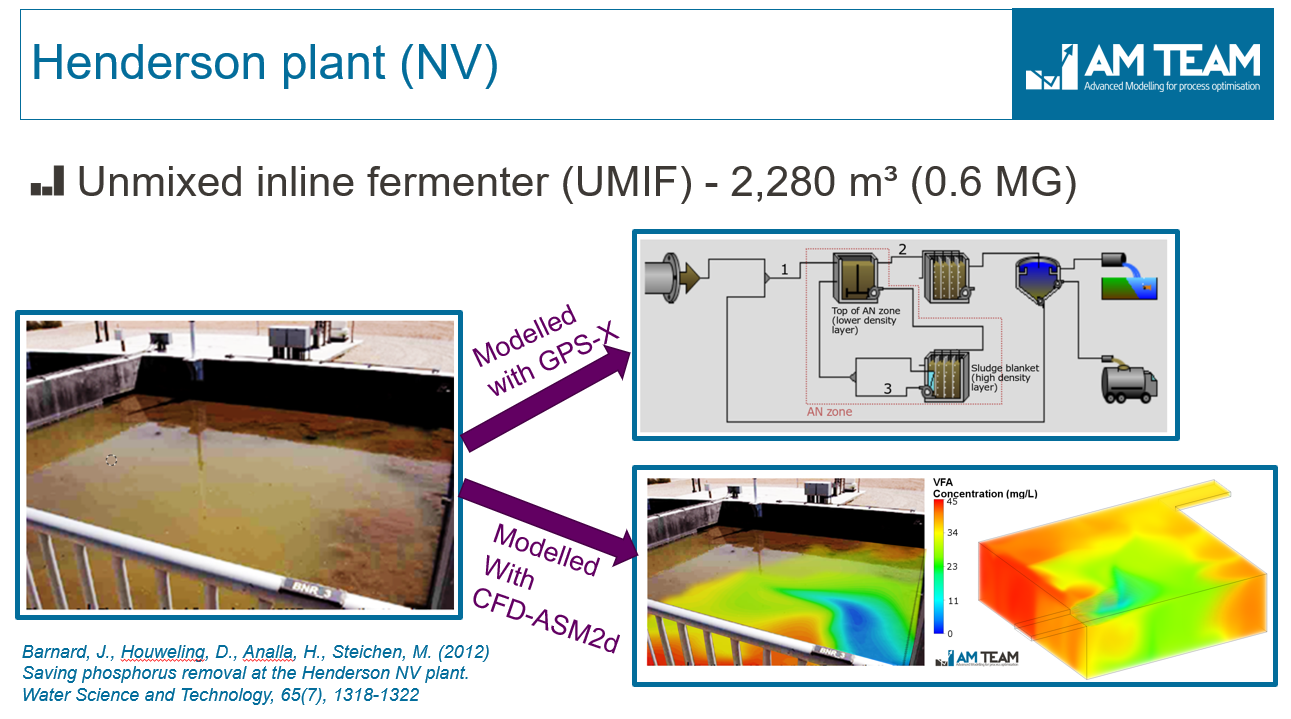
In this case study, we modelled a sludge fermenter very similar to the ones at the Henderson Plant (NV, US). We wanted to know how process model predictions (an ASM2d model in GPS-X) compared to those of the 3D CFD-ASM2d model. In the CFD model, we modelled the sludge blanket explicitly (separate solid phase) for optimal accuracy.
Lesson 1: CFD-biokinetic modelling gives you the 3D insights, which are surprising and powerful
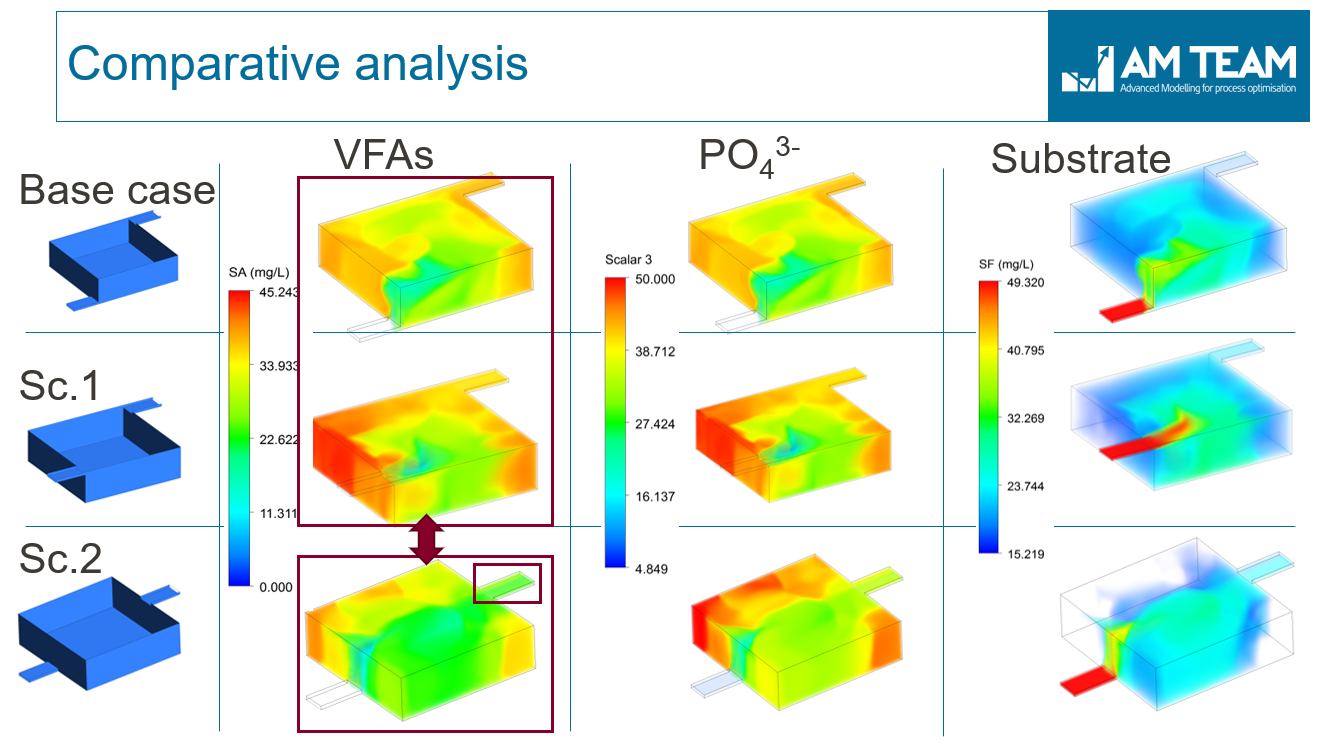
The figure below shows lots of results! We don't want to confuse you. There are just two things we wanted to highlight:
- CFD-biokinetic modelling gives you the concentrations of VFAs, COD and nutrients in 3D. And they show that large gradients exist in such systems, both mixed and unmixed.
- The inlet and outlet location, baffles, .... can be changed in the CFD model (see little 3D geometries on the left for different scenarios). Those subtle design changes have a large impact on the kinetic conversions, and hence process performance.
Let's highlight the heterogeneity of VFAs in this 3D space very clearly using Rehman-Nopens curves (curves that summarize the 3D CFD results on one simple 2D graph). This graph shows the concentration distribution of VFAs. For example '50% of the fermenter volume has a VFA concentration of 30mg/L or less, for Scenario 2'.
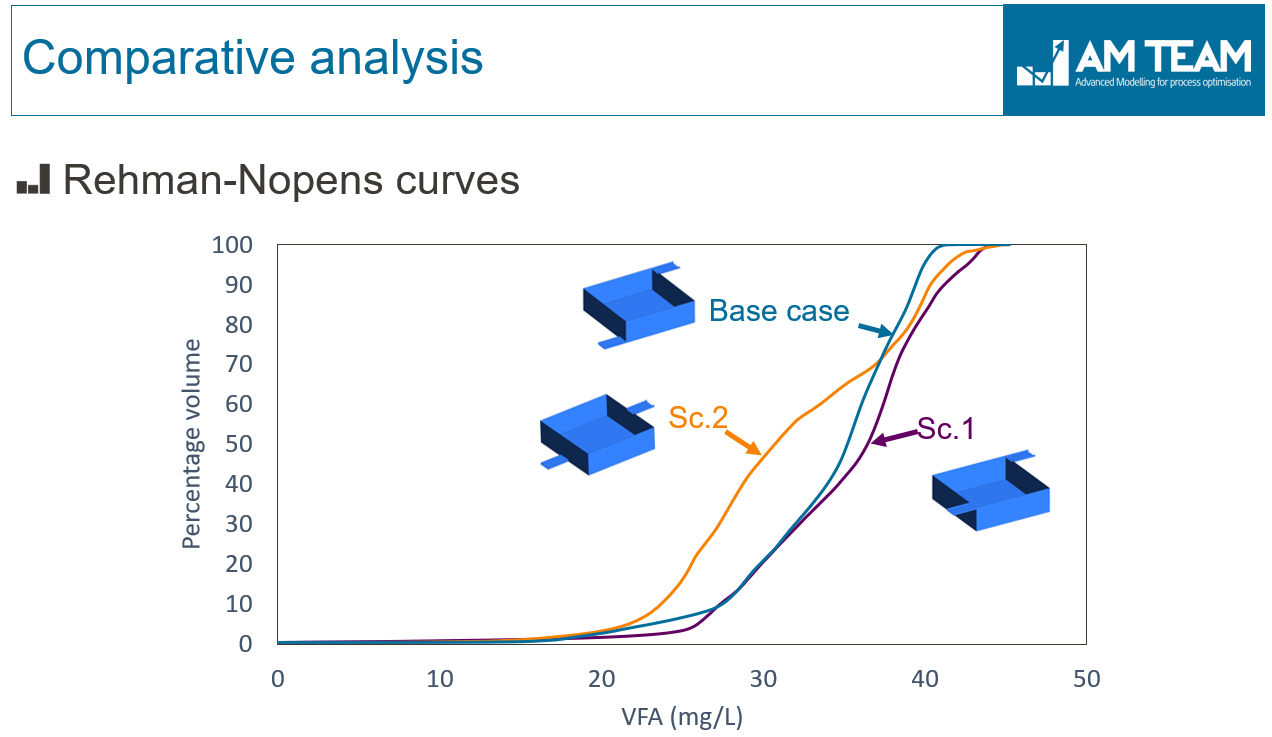
It becomes clear that putting the inlet at the bottom or top does not really make a difference (base case and Scenario 1 are almost the same). Influent always goes via the top, due to density currents. However, the Scenario 2 design is quite significant in different aspects... We did not want to argue here about what is 'good vs bad design'. The point is: the model detects the impact of such important decisions.
Lesson 2: Process models probably need a lot of recalibration due to the black box assumptions with regard to mixing
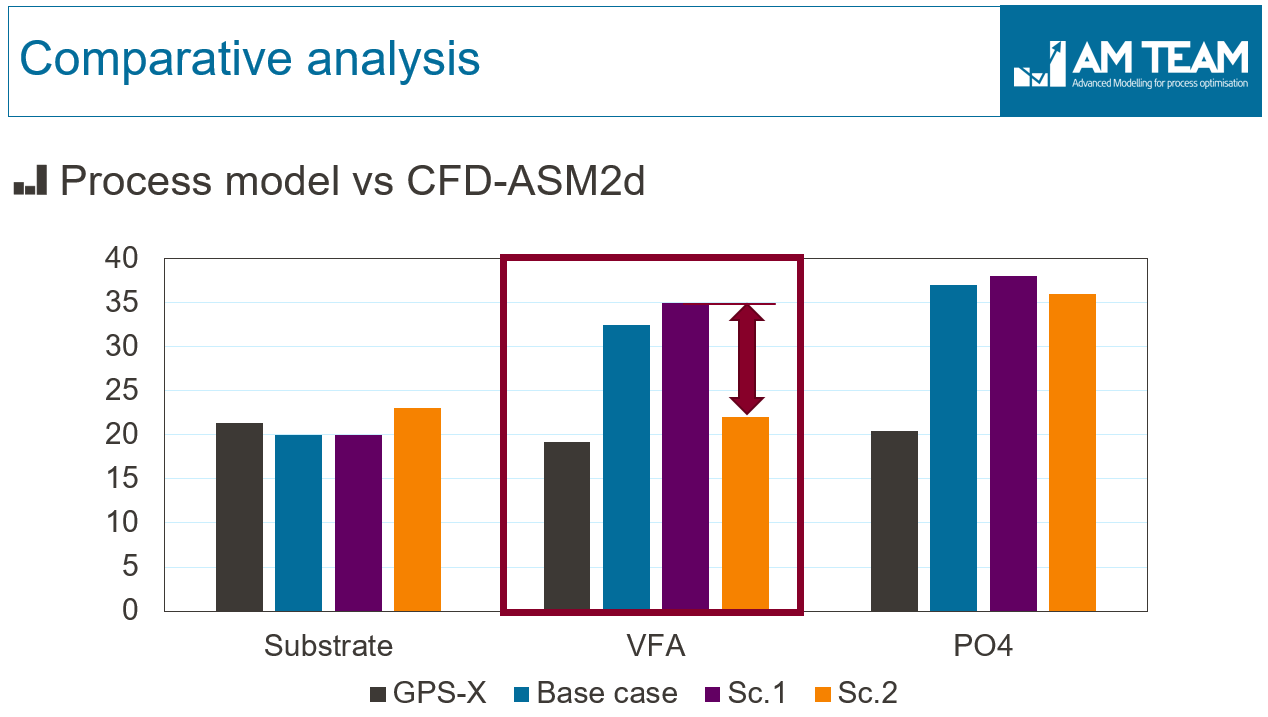
So here is the overall comparison between the effluent values predicted by the CFD-ASM2d and GPS-X model.
- While for some variables, no differences exist (e.g. RBCOD (rapidly fermentable substrate),there are significant differences for others (e.g. VFAs and ortophosphate)
- Changing the reactor design leads to clear differences in process performance, not detected by the GPS-X model. Again, the CFD model is a powerful reactor design tool. The GPS-X model is a powerful process train design tool.
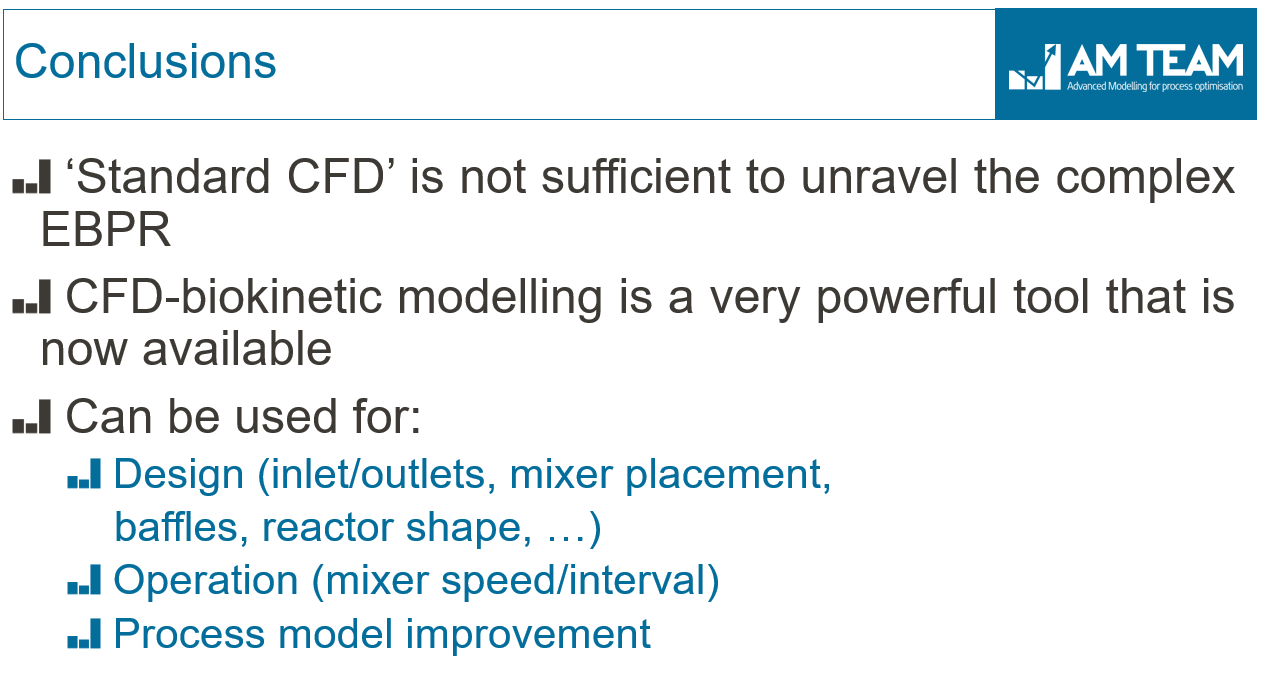
Conclusions
Here's what we've put on the last slide:
Contact us


Subscribe to our newsletter


