How advanced CFD modelling accelerates and improves the design and scale-up of membrane applications
This article was originally publised at TheMBRsite.com. It gives a complete overview of the status and opportunities of advanced membrane modelling for better design.
Most water practitioners today recognise Computational Fluid Dynamics (CFD) as being a means of realistically simulating 3D flow within a reactor or treatment process, largely based on fluid physics. Design and/or operational aspects of the process can then be adjusted virtually to obtain the desired system and understand what is happening inside it. Today’s models and computational power allow for direct coupling of process phenomena (such as bubbles, particles and reactions) with CFD. This has created new opportunities for carrying out key tasks virtually, including experimenting, prototyping, and piloting/scale-up. This article addresses the concept of “advanced CFD” and illustrates its practical value and potential using three very different membrane-related examples.
The current status of CFD
A water/wastewater treatment process can be governed by may phenomena (Fig. 1). The technology designer’s role is to control these phenomena as much as possible in a well-designed treatment process. But, as the figure shows, there are many design and operational variables. To physically test all of them (and their combinations),is costly and practically infeasible: an informed selection is often required. In the case of MBRs, typical design variables are (a) the membrane configuration (dimensions, spacing and location),and (b) the inlet and outlet positioning and design of the aerators (optimal bubble size and number of aerators and their position).
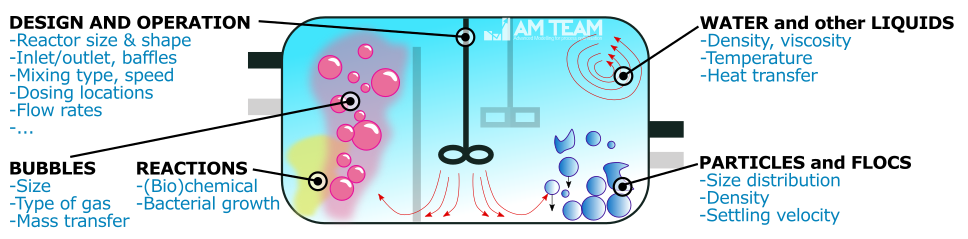
Figure 1: The important process phenomena in water and wastewater treatment processes
Compared to ‘plain CFD’ which only considers the hydraulics, advanced CFD takes into account one or more of the process phenomena, including both the biochemical reactions and the different phases (Fig. 2). This then leads to very realistic 3D models that can complement, reduce or replace physical experimenting. For example, CFD combined with biokinetics will not only shed light on potential ‘dead zones’ but also on permeate quality (e.g. ammonia levels) as function of operation and design. The complexity of the model (i.e. which process phenomena to include) must be chosen in line with well-defined objectives (i.e. a desired quality/limit, energy consumption, footprint, capacity, etc.).
Advanced CFD can be demonstrated with reference to three different case studies where the aim was virtually design or scale-up MBR technologies.
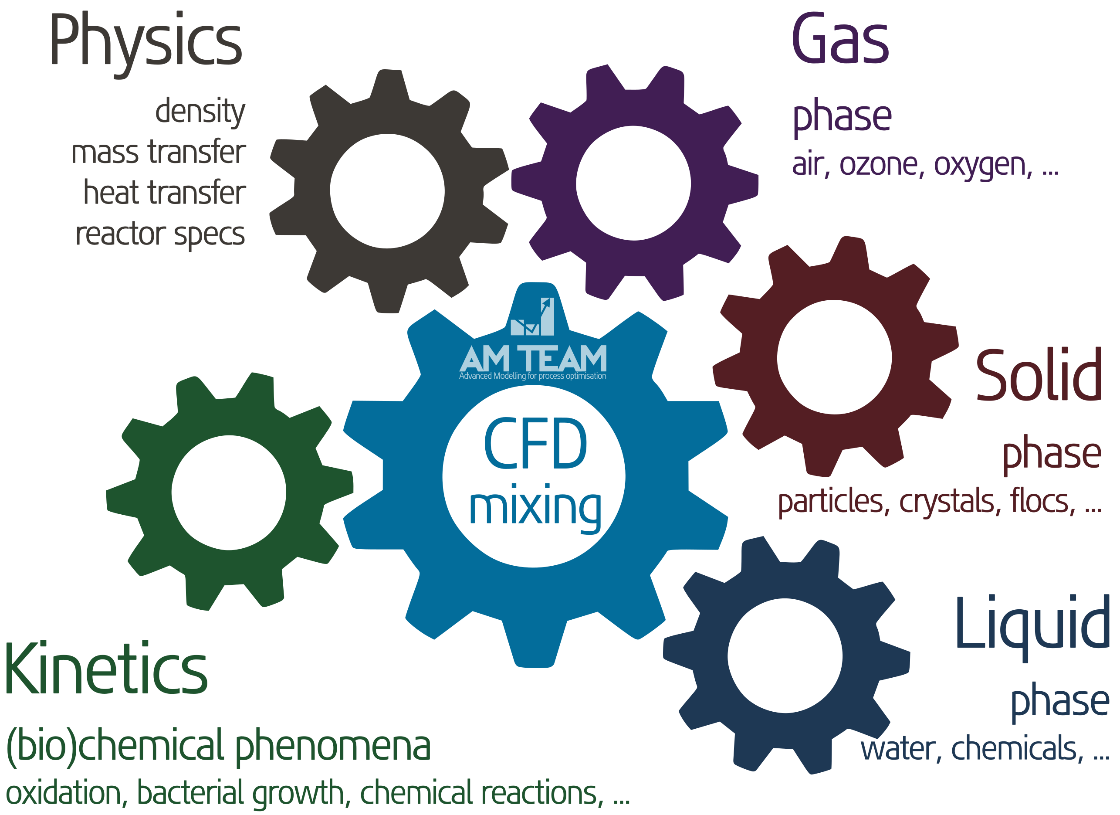
Figure 2: Advanced CFD, taking into account one or more process phenomena
CASE I: Virtual scale-up of a baffled MBR (BMBR)
The baffled MBR (BMBR) concept is a novel MBR reactor type having a single reactor compartment (http://maezawa.co.jp). This avoids pumping between aerobic and anoxic zones and minimizes the requirement of a mixer for the anoxic zone, thereby reducing pumping and mixing costs. Advanced 3D modelling was used to virtually scale-up an existing 15 m³/d pilot to a well-performing 400 m³/d large-scale installation within a few months without additional piloting. The CFD model accounted for fine and coarse bubble aeration, high sludge concentration and biokinetic conversion of COD and nutrients.
The BMBR concept
The MBR is operates in cycles (Fig. 3): wastewater is intermittently introduced while permeate exits the system continuously. This produces alternately rising (while feeding) and falling (during membrane filtration) system water levels throughout the cycles, with one cycle typically taking ~10-20 minutes.
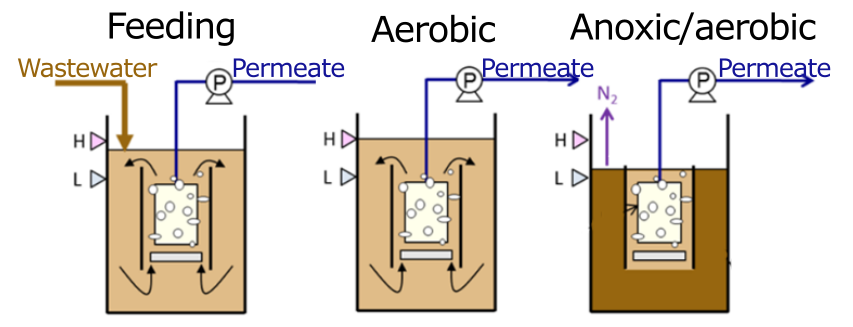
Figure 3: the BMBR cycle with alternating feeding and drawing (figure adapted from Kimura et al. 2008)
The hollow-fiber MF membranes are located in the middle of the reactor and both fine and coarse bubbles are introduced under the membranes for aeration and scouring respectively (Figs. 3-4). The 3D baffle surrounding the membrane creates alternating aerobic and anaerobic regimes in the outer compartment throughout the cycles. If the water level is higher than the baffle height, oxygen and nitrate formed as a result of nitrification inside the baffle can enter the outer region while at low water levels oxygen depletion occurs and hence denitrification is promoted at the outer region.
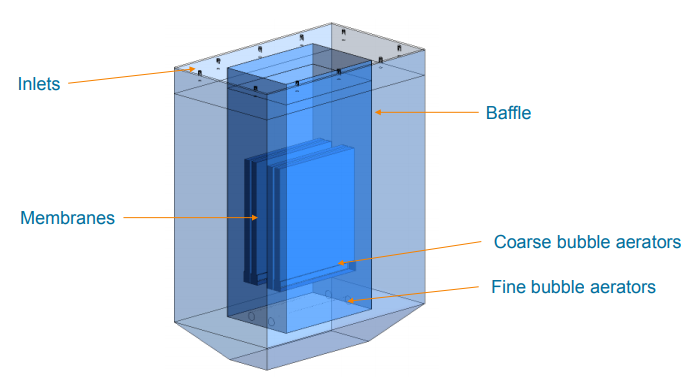
Figure 4: conceptual build-up of the BMBR with its most important parts (feeding occurs via multiple identical inlets equally spread at the top of the bioreactor)
The scale-up challenge
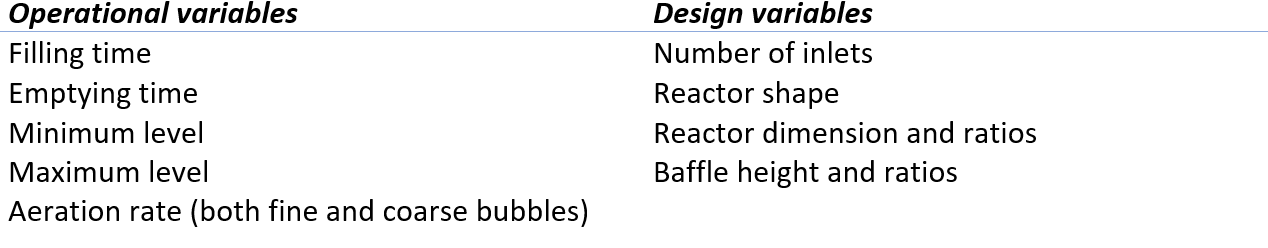
Trial-and-error based scale-up of this BMBR is challenging because of the many operational and design variables requiring optimisation (Table 1). Determining the optimal combination of these variables through physical piloting would have been costly and time consuming, while testing freedom would have been very limited. Virtual piloting offered an elegant solution since many different designs (five in this case) could be rapidly tested.
Table 1: The degrees of freedom that should be configured rightly for optimal performance
The advanced 3D model
All of the variables in Table 1 were tested using an advanced 3D CFD model simultaneously accounting for:
- Hydrodynamics
- Sludge density, associated with the solids concentration
- Coarse bubble aeration
- Fine bubble aeration
- Biokinetics (biological organic matter and nitrogen removal)
- The cyclic (‘transient’) behaviour
This model provided 3D profiles of air, carbon (BOD and COD),oxygen and nitrogen species both inside the reactor and the permeate. After successful model validation using the operating pilot-scale system, the model was ready to use for virtual piloting. An example of typical simulation results is given in Figures 5 and 6 for gas holdup.
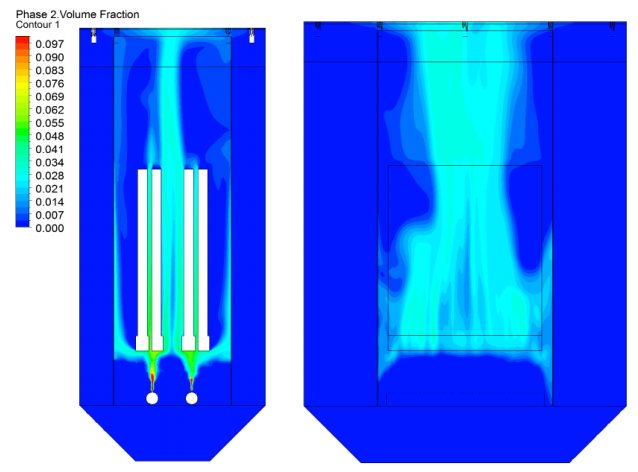
Figure 5: Gas holdup distribution inside the BMBR (two different view planes)
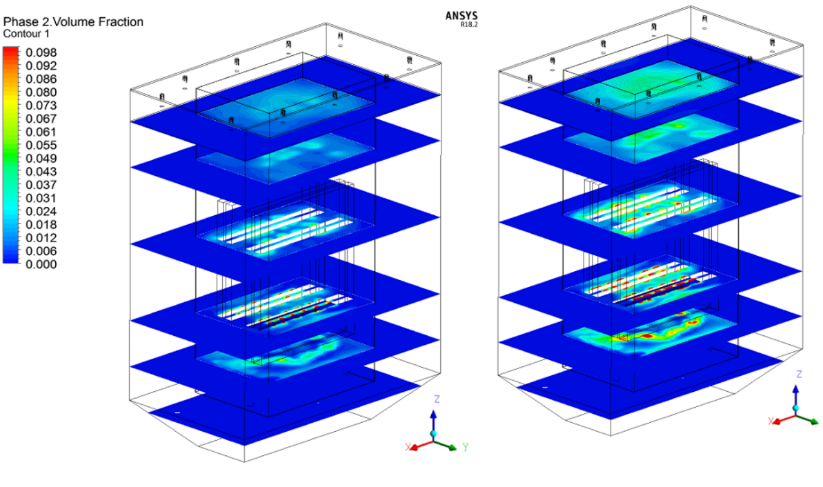
Figure 6: Gas holdup distribution at different levels in the BMBR
Virtual piloting: designing the optimal large scale MBR at the computer
Different design scenarios were tested, whereby many combinations of the operational and design variables in Table 1 were virtually tested. A final ‘hybrid’ design (i.e. a design based on a combination of the variables) led to satisfactory permeate quality. It become clear (Fig. 7) that although all the different candidate designs had identical treatment capacities, performance varied significantly. This demonstrates the importance and value of the flexibility provided by virtual testing.
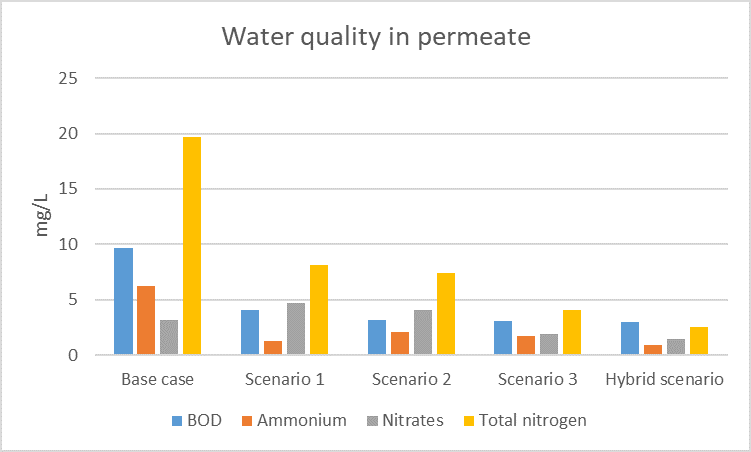
Figure 7: Permeate water quality (total nitrogen) obtained with different full-scale designs.
Conclusions
Using virtual scale-up, Maezawa Industries, Inc. obtained a promising full-scale design within a ten week period without additional physical piloting. The validated advanced 3D model provided sufficient confidence to build the large-scale BMBR suggested by the model. Preparations are currently ongoing. The project was conducted by AM-TEAM.
Acknowledgement
This result is a part of the Japanese national project conducted by Maezawa Industries Inc. supported by New Energy and Industrial Technology Development Organization (NEDO) in Japan.
CASE II: Virtual design of a novel flat sheet MBR module
The Belgian company Blue Foot Membranes (https://bluefootmembranes.com) has commercialized the IPCTM (Integrated Permeate Channel) membrane: a fully backwashable flat sheet membrane. Advanced 3D modelling was used to optimise the air scouring over the membranes and across the module. Eight different virtual prototypes with varying aerators and aerator configurations were evaluated within a few weeks without the need to build and test physical prototypes. The model accounted for fine or coarse bubble aeration, high sludge concentration and flow patterns (i.e. shear) along the membrane surface.
The IPCTM technology and modules
The IPCTM permeate channel consists of an open 3D spacer fabric on which the membrane layers are directly coated. This mechanical anchoring of the membrane in the fabric allows for rigorous backwashing, up to 2 bar. The individual flat sheets are placed in modules (Figures 8a and b) that contain different aerators at the bottom (Figures 8b and c).
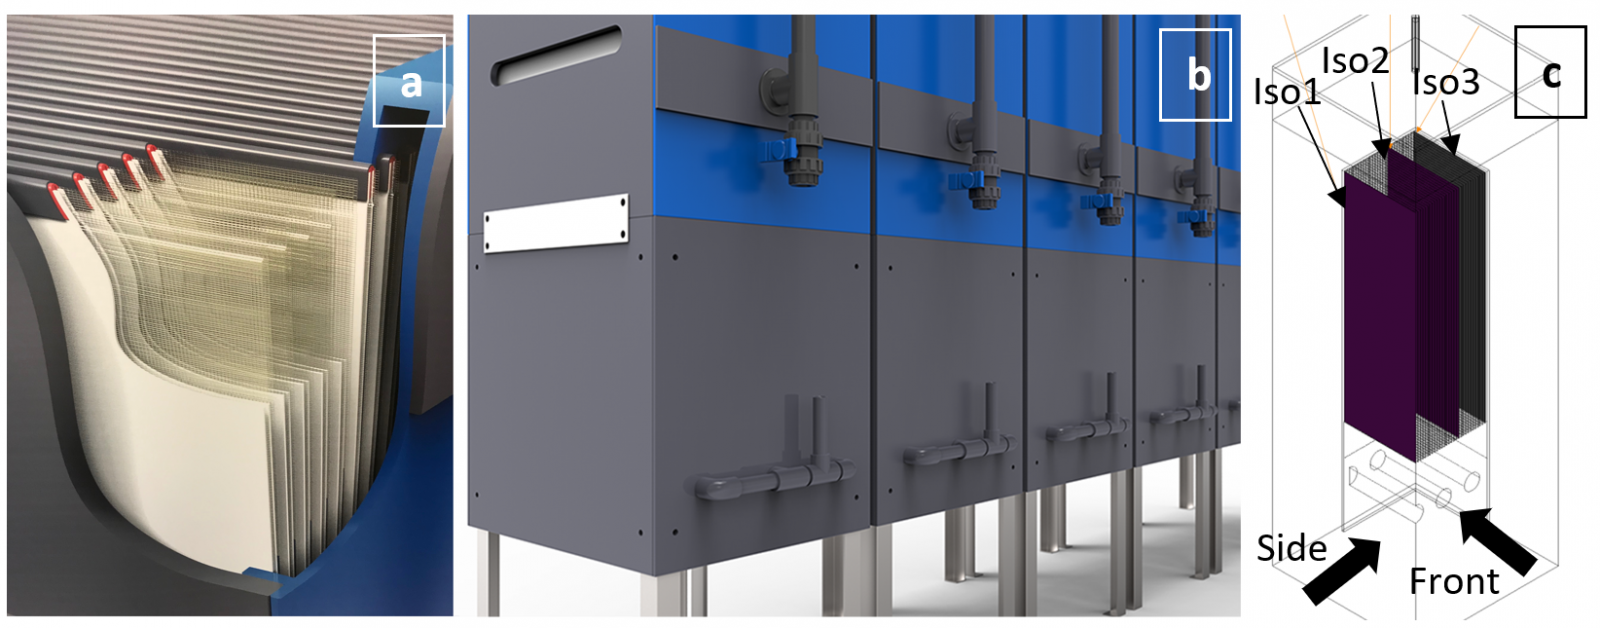
Figure 8: An IPCTM module holding the flat sheet membranes (a),module stack (b) and inner geometry with aerator pipes at the bottom (c)
The design challenge
Blue Foot Membranes wanted to maximise air scouring performance across the whole module, on every membrane, since non-optimised scouring (i.e. shear) could lead to local fouling. Building physical prototypes to extensively test all the operational and design variables (Fig. 9) was impractical. Virtual testing offered a more feasible solution.
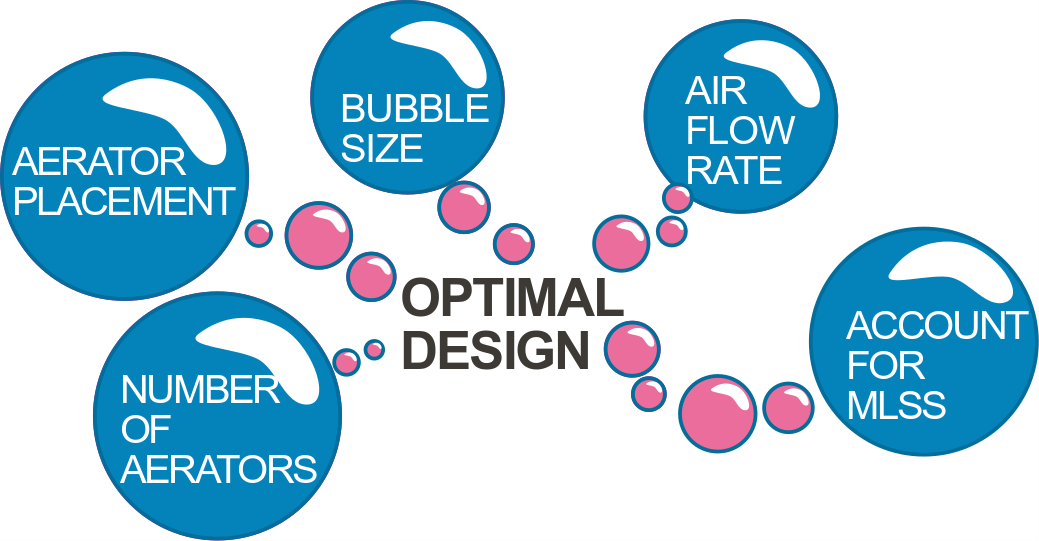
Figure 9: The important design and operational variables impacting aeration performance in an MBR module
The advanced 3D model
All of the variables depicted in Figure 9 were tested using an advanced 3D CFD model simultaneously accounting for:
- Hydrodynamics
- Sludge density (as MBRs have high MLSS levels within a wide range)
- Either coarse or fine bubble aeration
- Accurate shear flow simulation and shear calculation between the flat sheets
This realistic model provided 3D profiles of air and water flows (Figure 10) and visualised and quantified the local shear on every individual membrane sheet (Figure 11).
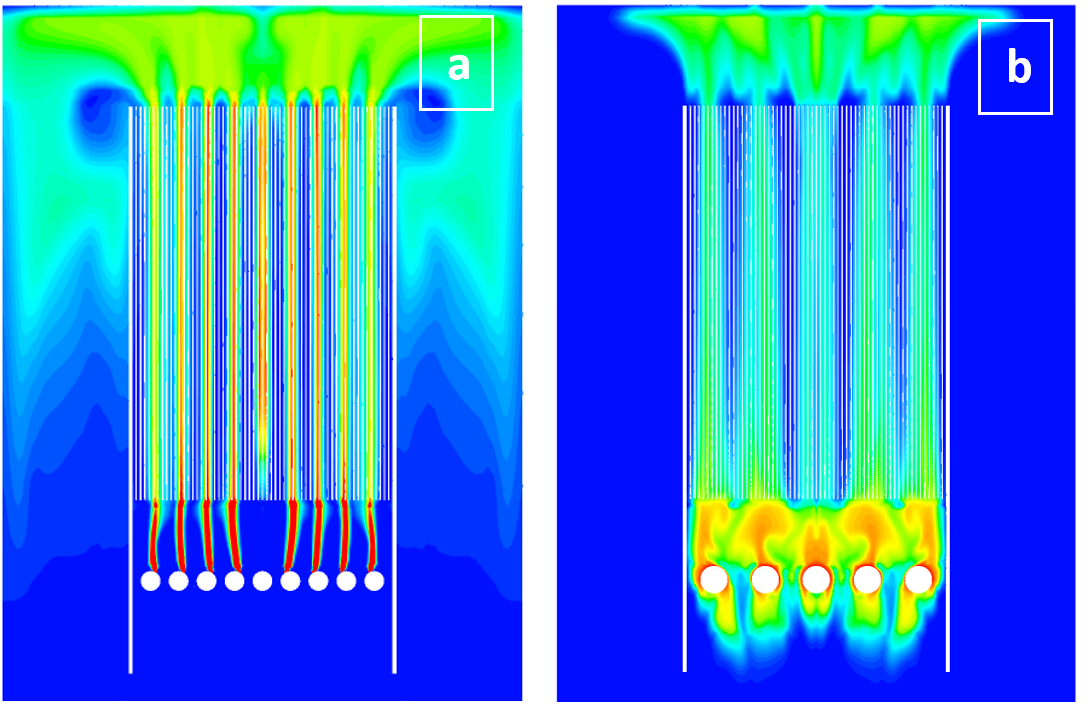
Figure 10: How bubbles travel between the sheets in the case of fine (a) and coarse (b) bubble aeration (dark blue = no bubbles: yellow/orange = high air concentration). Coarse bubbles clearly short circuit between certain channels (front view of the module, with pipes perpendicular to the module wall (see Figure 8c))
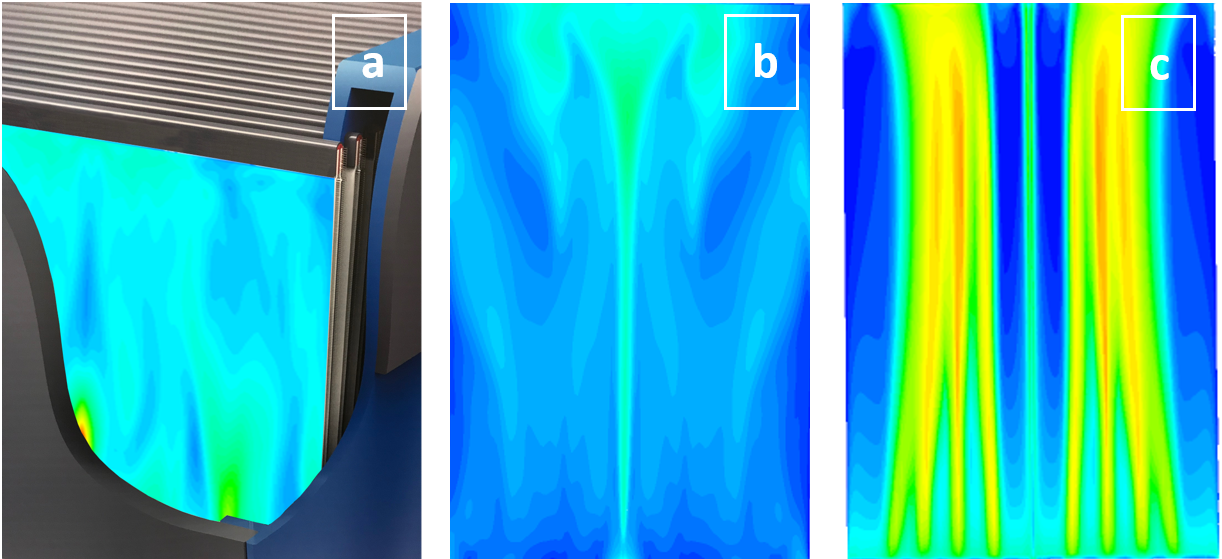
Figure 11: Shear visualisation on (a) the membrane sheets, and on a single membrane (Iso 3 in Figure 8c) for (b) fine and (c) coarse bubble aeration. Coarse bubbles give higher local shear, but almost no shear in other zones, increasing the risk of local membrane fouling.
Virtual testing: designing the optimal module at the computer
In this case, shear over 30+ membrane sheets had to be clearly visualised and presented as such that design decisions could be taken. Using Rehman-Nopens curves, the 3D CFD results were translated to clear 2D graphs. These curves are cumulative representations of all local shear values on the 30+ membrane sheets:
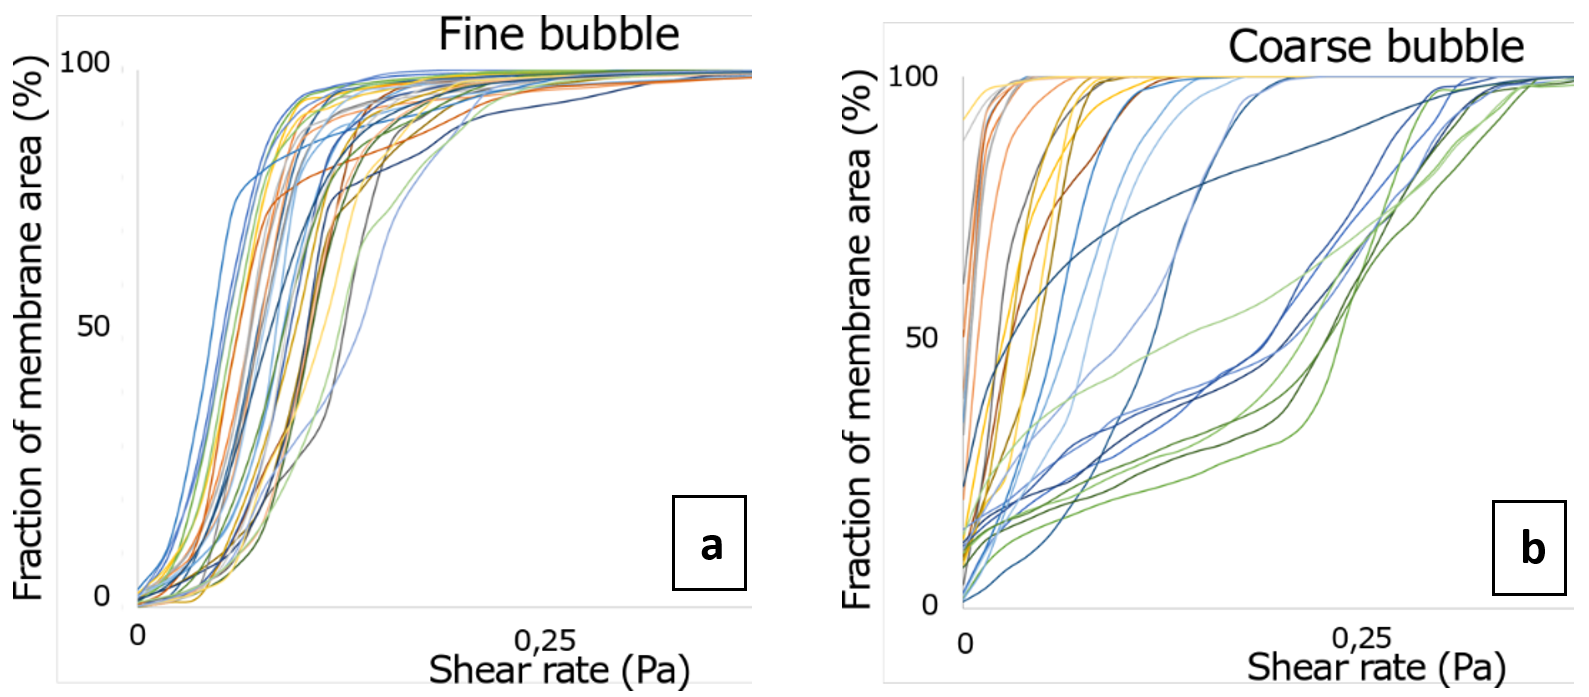
Figure 12: Rehman-Nopens curves for shear on each individual sheet for fine (a) and coarse (b) bubble aeration. Each sheet is one curve. The steeper the curve, the more homogeneous the shear (i.e. every region on a sheet has a similar shear); the more the curve shifts to the right, the higher the overall shear. In the ideal module, all membranes have similar curves.
As seen in Figure 12, coarse and fine bubbles differed significantly both in terms of shear distribution over the different sheets and over one individual sheet. Using finer bubbles, local fouling would be less likely to occur. Some extra virtual ‘what if’ design scenarios with fine bubbles were tested whereby the aerator configuration was optimised to further improve the curves in Figure 12a (results not shown).
Conclusions
Using virtual design, Blue Foot Membranes obtained an optimised IPCTM membrane module in a few weeks time without additional physical testing. 3D CFD results were translated in 2D Rehman-Nopens curves that were used to guide the virtual design iterations. In a forthcoming project, the model will be validated and used further to optimise other design aspects. The project was conducted by AM-TEAM.
CASE III: Virtual dissection of helix technology
Pentair (https://pentair.com) developed ‘twisted’ membranes, by introducing a helical ridge inside tubular ultrafiltration membranes to promote turbulence through helical flow (Fig. 13). This ridge delivers up to 100% higher productivity, reducing the energy costs by 50% by lowering pump costs. An advanced CFD model could indicate the exact physics behind this improved design and thereby provide useful information for further optimisation. CASE III is a somewhat more fundamental study executed at Ghent University.
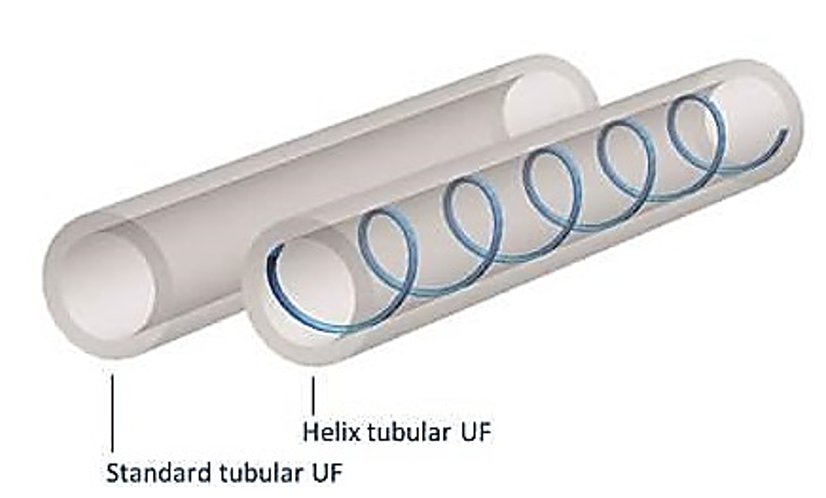
Figure 13: Design of the helical ridge in tubular membranes (xflow.pentair.com)
The design challenge
CFD can help in identifying the key mechanisms of this design, after which it can be used to optimise the turbulent energy distribution for fouling abatement. Although the principle of this design may seem intuitive, there is a possible number of mechanisms through which this design delivers its efficiency, including shrinking of the laminar boundary layer, turbulent eddies diminishing the concentration gradients, increased shear stresses at the membrane, increased flow velocity, etc. Factors to include in this exercise are both operational parameters (cross flow velocity and flux),and design parameters for the membranes (tube diameter) and for the helix (pitch, ridge height, cross sectional shape).
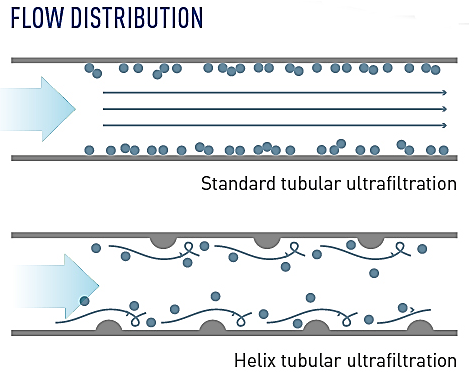
Figure 14: Missing knowledge on the exact working principles of the helix (xflow.pentair.com)
The advanced 3D model
To investigate the impact of this small-scale structure on e.g. the developed turbulence, a more detailed CFD approach than usual was applied. This so-called Large Eddy Simulation quantified local velocities very accurately. The main flow characteristics were unravelled from these results, pointing towards higher wall shear stresses near the membrane as a dominant mechanism for fouling control.
It can be seen from Figure 15 that the membrane with helical ridge gives rise to a broader distribution of shear values which are also shifted to higher values compared with the standard membrane tube. The highest shear values were found on the helical ridge itself and the lowest in a shadow zone behind this ridge. These low values (around 6% of the total membrane surface) are even lower than what would be encountered in a normal tubular membrane and thus form a point of attention for potential fouling.
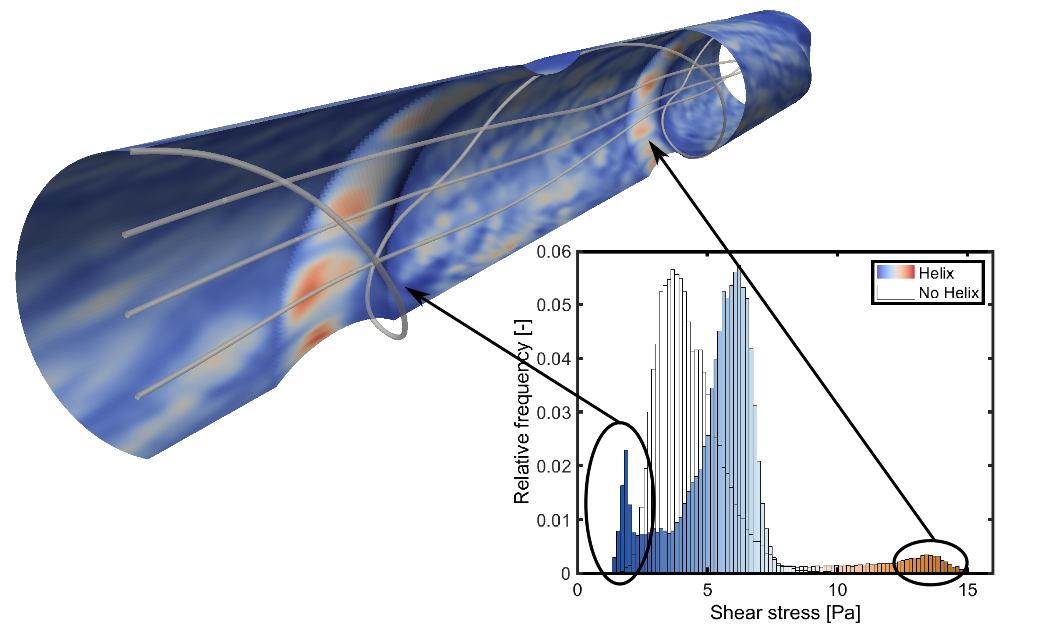
Figure 15: Wall shear stress values are heavily impacted by the introduction of the helix. These values are, however, heterogeneously distributed, with high values on the helical ridge and low values in a shadow zone behind the helix (DOI: 10.1021/acs.iecr.8b02959)
On top of this, centrifugal force fields could be calculated on hypothetical particles of around 50µm in size, indicating that the helix also gave rise to an extra and significant centrifugal force, pushing particles towards the membrane. This force was significant within this shadow zone, aggravating the existing ‘shadow zone’ effect.
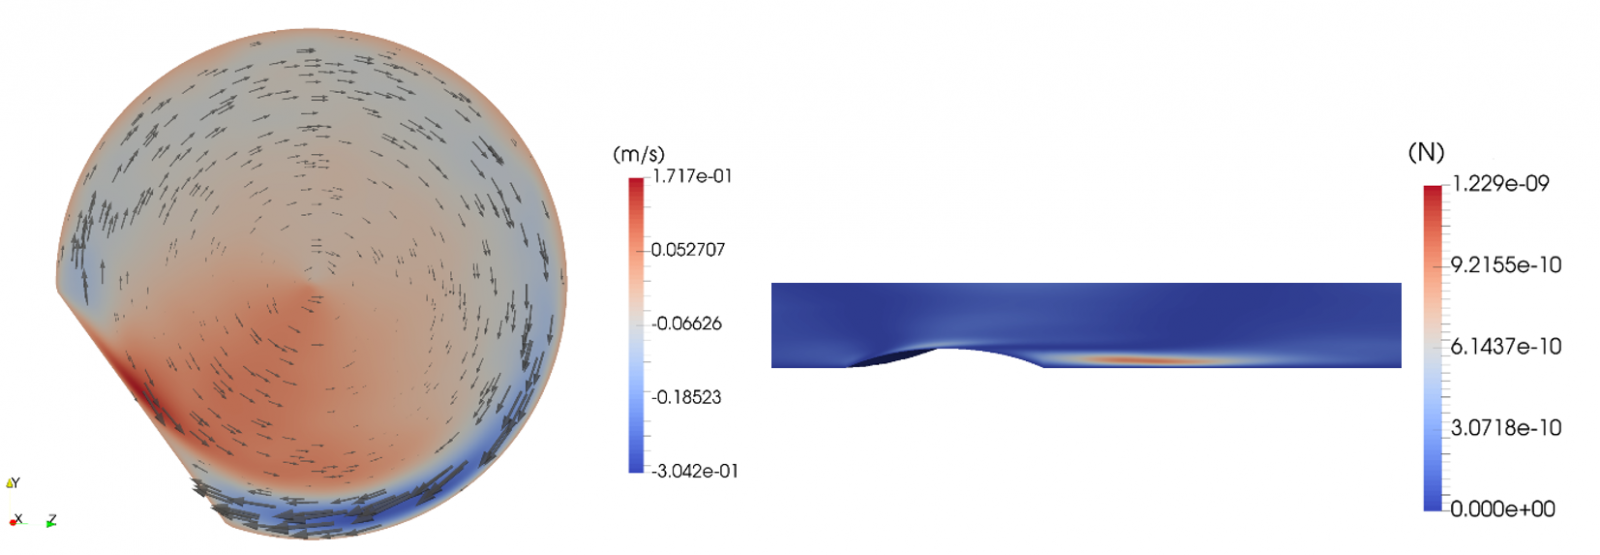
Figure 16: Within the shadow zone, increased centrifugal forces are seen (left). Tangential velocities in a cross section show the highest velocities in the shadow zone (right). As a consequence, the highest centrifugal forces are found within the shadow zone (DOI: 10.1021/acs.iecr.8b02959).
Virtual design: designing the optimal spiral shape at the computer
Based on these results, recommendations can be formulated to improve the operation of tubular membranes with helical ridge in terms of membrane fouling control. From an operational perspective, the periodic reversal of the main flow direction between filtration cycles would switch the high and low shear zones within the tubular membrane, altering the region of the shadow zone. From a more structural point of view, the shadow zone might be eliminated by employing an airfoil cross section (as of an airplane wing) to cover this zone and make the opening of the channel after the helical constriction less abrupt.
Conclusions
Using CFD simulations as a tool, the existing innovation of helical tubular membranes could be appraised and the primary working principle of increased wall shear stress identified. While doing so, the limiting factor of the technology became apparent, offering the possibility of future design optimisation.
Acknowledgement
These results were generated by the BIOMATH group, part of the Department of Data Analysis and Mathematical Modelling at the faculty of Bioscience Engineering, Ghent University (http://biomath.ugent.be). The financial support of the Research Foundation Flanders (FWO research grant 1.5.253.14N) is gratefully acknowledged. This research was performed in a collaboration with partners from GOA project BOF16/GOA/004 at Ghent University. Computational resources and services were provided by the VSC (Flemish Supercomputer Center),funded by the Research Foundation - Flanders (FWO) and the Flemish Government - department EWI. More information can be found within the publication (DOI: 10.1021/acs.iecr.8b02959).
General conclusion
Current simulation tools are powerful and can realistically consider process phenomena on top of hydraulic flow patterns. This was shown based on three very different membrane related case examples. Advanced CFD is increasingly used by technology developers and end users to optimise, design and scale-up their technologies. 3D computer simulation can reduce, replace or complement real-life testing. Further, it extends knowledge extension by providing high resolution data that cannot be collected with real-life testing. In MBR applications, the value especially lies in OpEx minimisation, footprint reduction, fouling control, optimisation of performance and the reduction of real-life experimenting and testing.
Authors: Dr. Wim Audenaert, Dr. Usman Rehman, Dr. Wouter Naessens, Prof. Ingmar Nopens
Contact us


Subscribe to our newsletter


