Saving costs and improving effluent by knowing what is happening in your bioreactor - Part 2
In this second episode of a series of articles on a globally unique advanced modelling project in the water sector, we'll explain how you can optimise a plant, based on 3D models. You'll learn how we digitally redesigned the plant to lower the effluent nitrate and to save operational costs. By adjusting a plant virtually you have more testing freedom and it's easier, faster, and less risky than real-life, full-scale trials. This is what we call 'what if' scenario testing.
Missed the first article? Read it here.
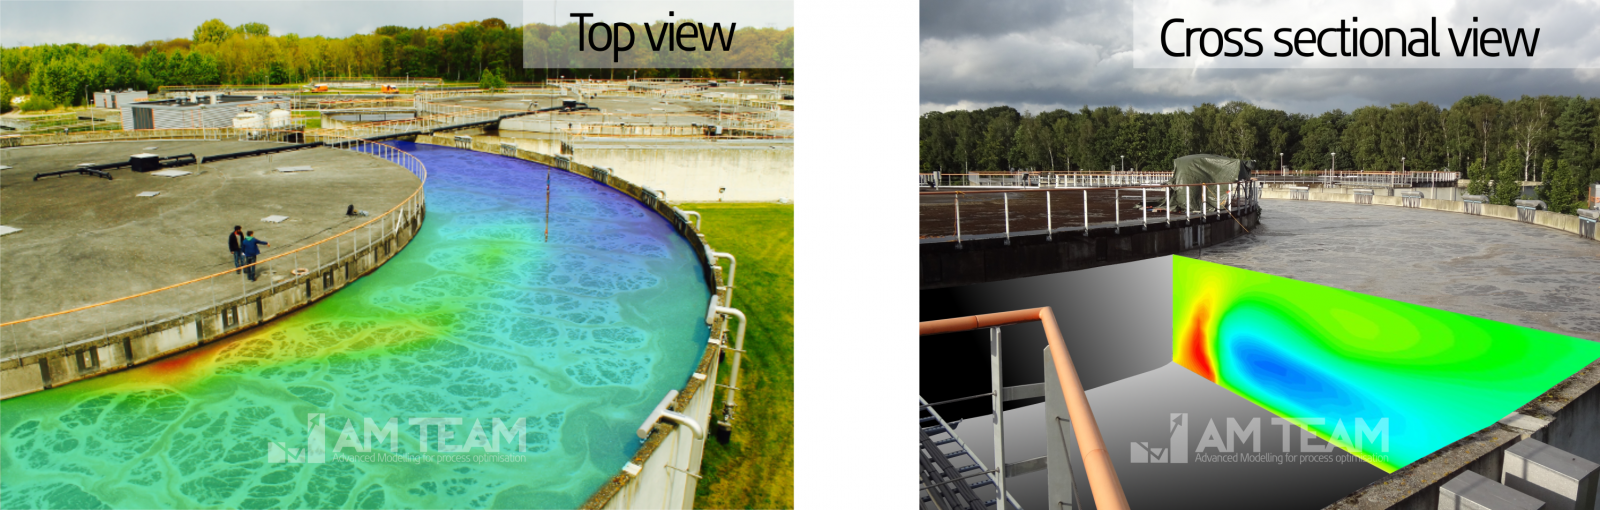
Figure 1: The aerated zone of one of the three identical bioreactors. The colours show simulated air distributions, with obviously higher oxygen levels near the inner wall, causing problems downstream
1. Part II: virtual re-design to improve effluent quality and save costs
The Eindhoven water resource recovery facility (WRRF) is a 750,000 p.e. conventional activated sludge plant operated by Waterboard De Dommel (Netherlands). While the plant operators want to lower effluent nitrate, low levels are hard to get, especially during cold weather. To find the optimal performance of the existing bioreactor, an advanced denitrification step is done before the plant upgrade to evaluate if an upgrade is needed. If you’ve read our first article on this project, you understand that the elevated oxygen levels near the intake of the anoxic tank may hinder denitrification in the bioreactor.
There are two very important aspects that will impact effluent quality and OpEx in this case:
- How you configure and operate the mixers
- How you configure and operate the aeration
Both interact and sometimes counteract each other, and both can be ‘played with’ virtually.
2. How we changed the plant, virtually
Essentially, any CFD model starts with a 3D CAD model like this:
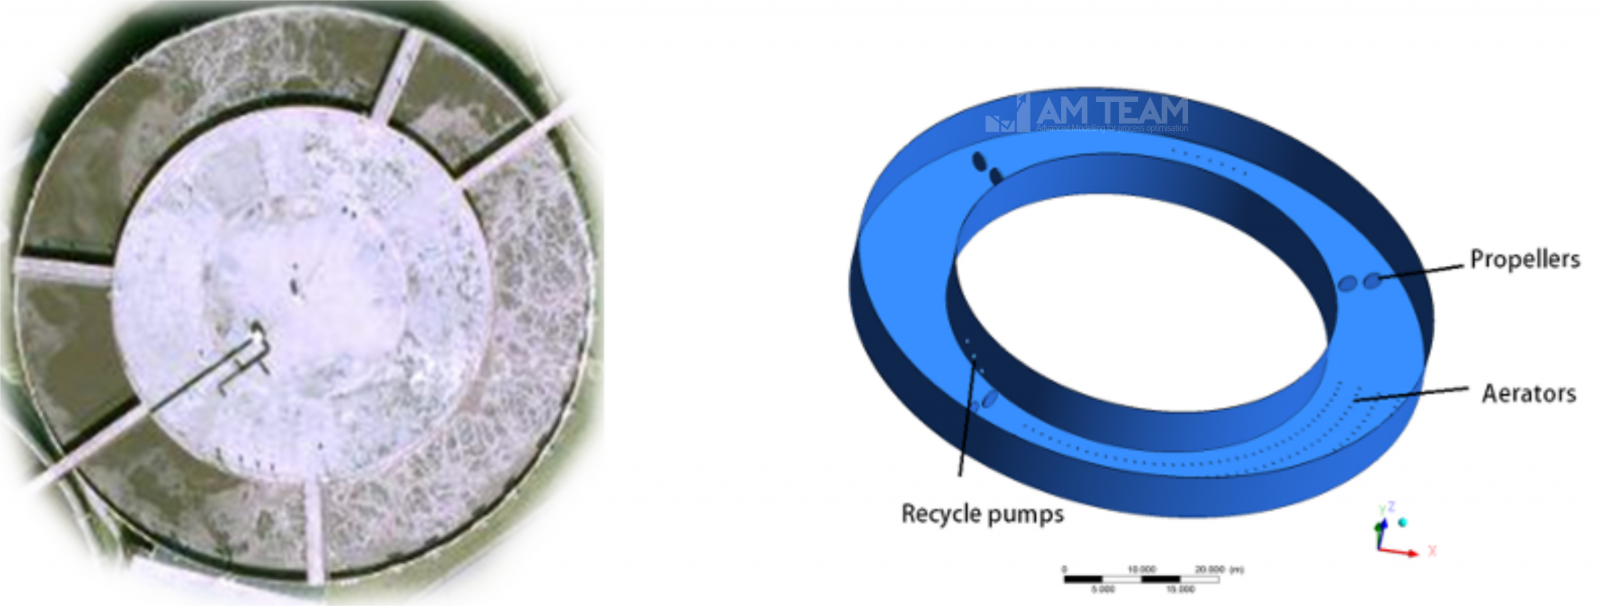
Figure 2: Top view (left) and 3D drawing (right) of the ‘outer ring’ of the bioreactor
Once you have a CAD drawing including the essential elements (propellers, aerators, recycle pumps etc),you can change it and simulate the impact of that change before implementing this in reality. And this is what we experimented with.
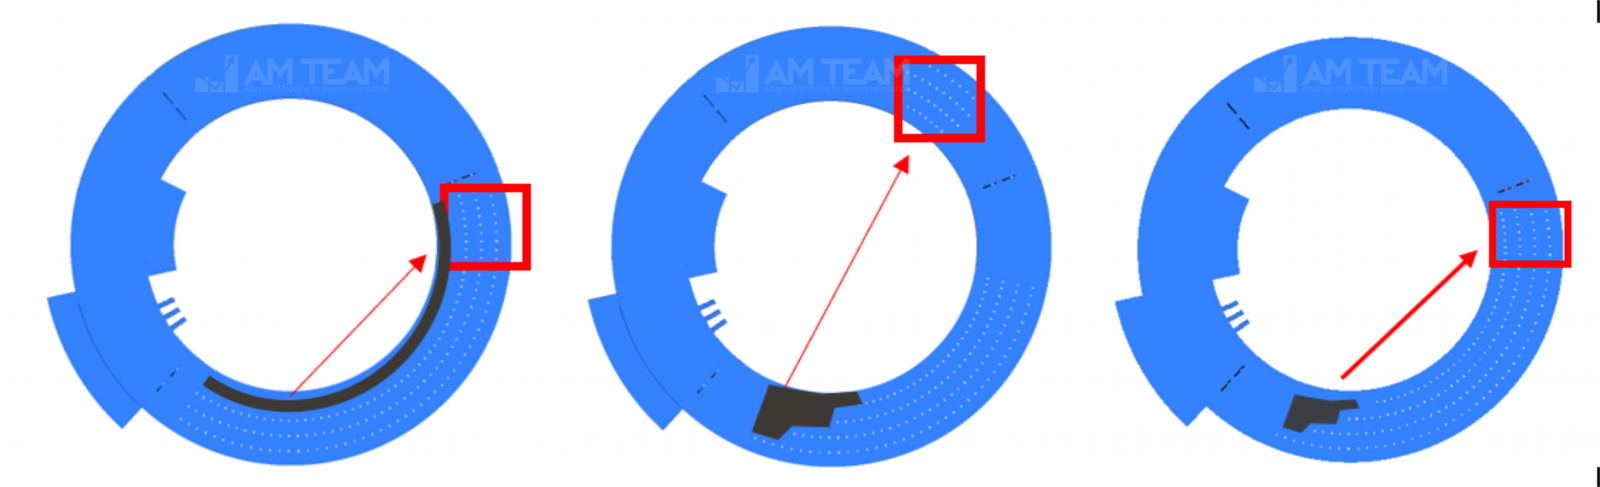
Figure 3: ‘what if’ we reconfigure aerators (more upstream) and/or switch off certain propellers at certain flow rates?
Our objective: How to lower the risk of high oxygen levels near the anoxic inlet (downstream from aerators),limiting effluent nitrate, while eventually saving costs?
What was the strategy?
- Check the impact of turning off certain propellers at certain flow rates. Which propellers and which flow rates should we adjust?
- Check the impact of re-configuring the aerators
- Check the impact of changing both, simultaneously
We tested 10 different ‘what if’ scenarios in the course of this project.
3. Results
Changing important design factors such as aerator configuration and mixer operation has a major impact on a bioreactor. Advanced CFD gives you the insights you need to design and operate your reactor optimally. The figures below show the gas holdup downstream the aeration (B is a few meters more downstream than A, and so forth).
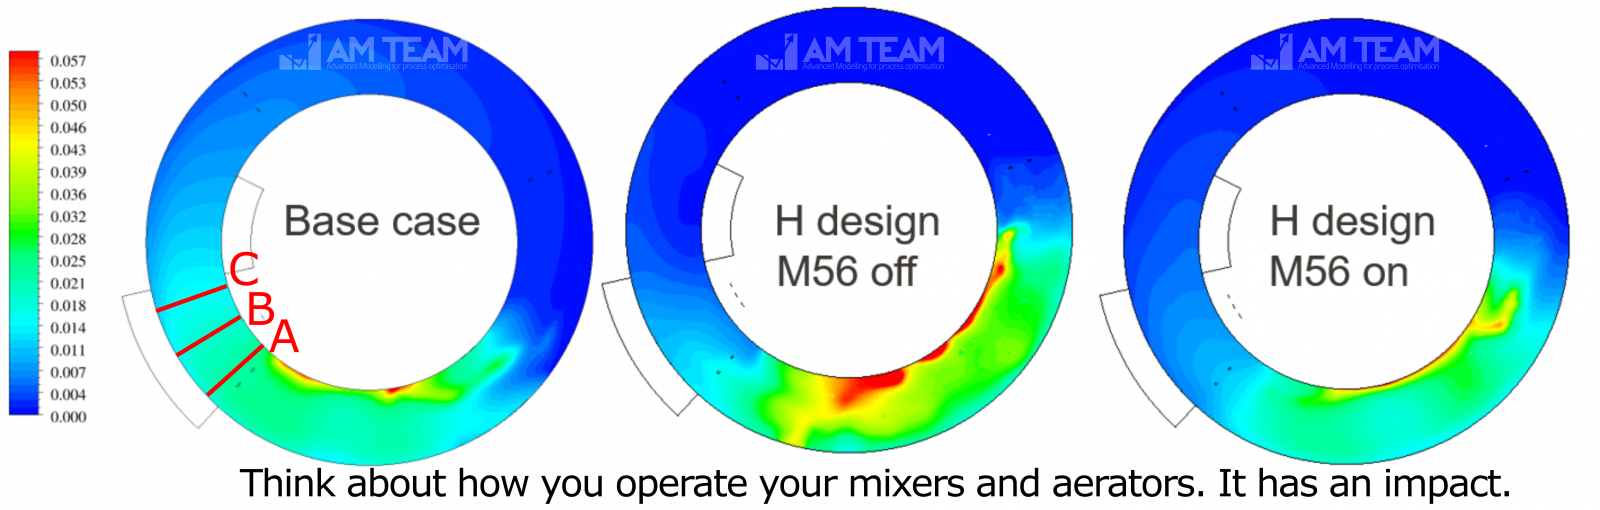
Figure 4: how the bubbles spread in the bioreactor (top view)
Upstream mixers control how bubbles in the aeration zone (do not) spread. The impact strongly varies as function of the plant flow rate and if bubbles are not spread evenly, it has downstream consequences (see cross-sectional views of the downstream region below). We noticed that at certain flow rates, it was better to completely switch off two of the six mixers in the bioreactor. This, of course, saves energy consumption.
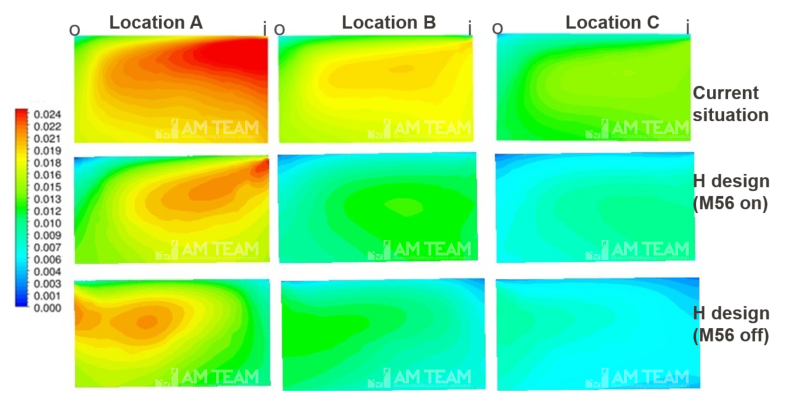
Figure 5: air distribution in the bioreactor, downstream of the aeration (cross-sectional view)
Switching off mixers while maintaining sufficient liquid velocity
What about the risk on local sludge settling if you switch off mixers? Let’s take a 3D look at the calculated local velocities. If you have read Part I, you now understand that these values are quite accurate. The dark blue regions with the lowest velocities still had values of around 0.35 m/s, which is still very decent (typically, you do not want to go below 0.25 m/s).
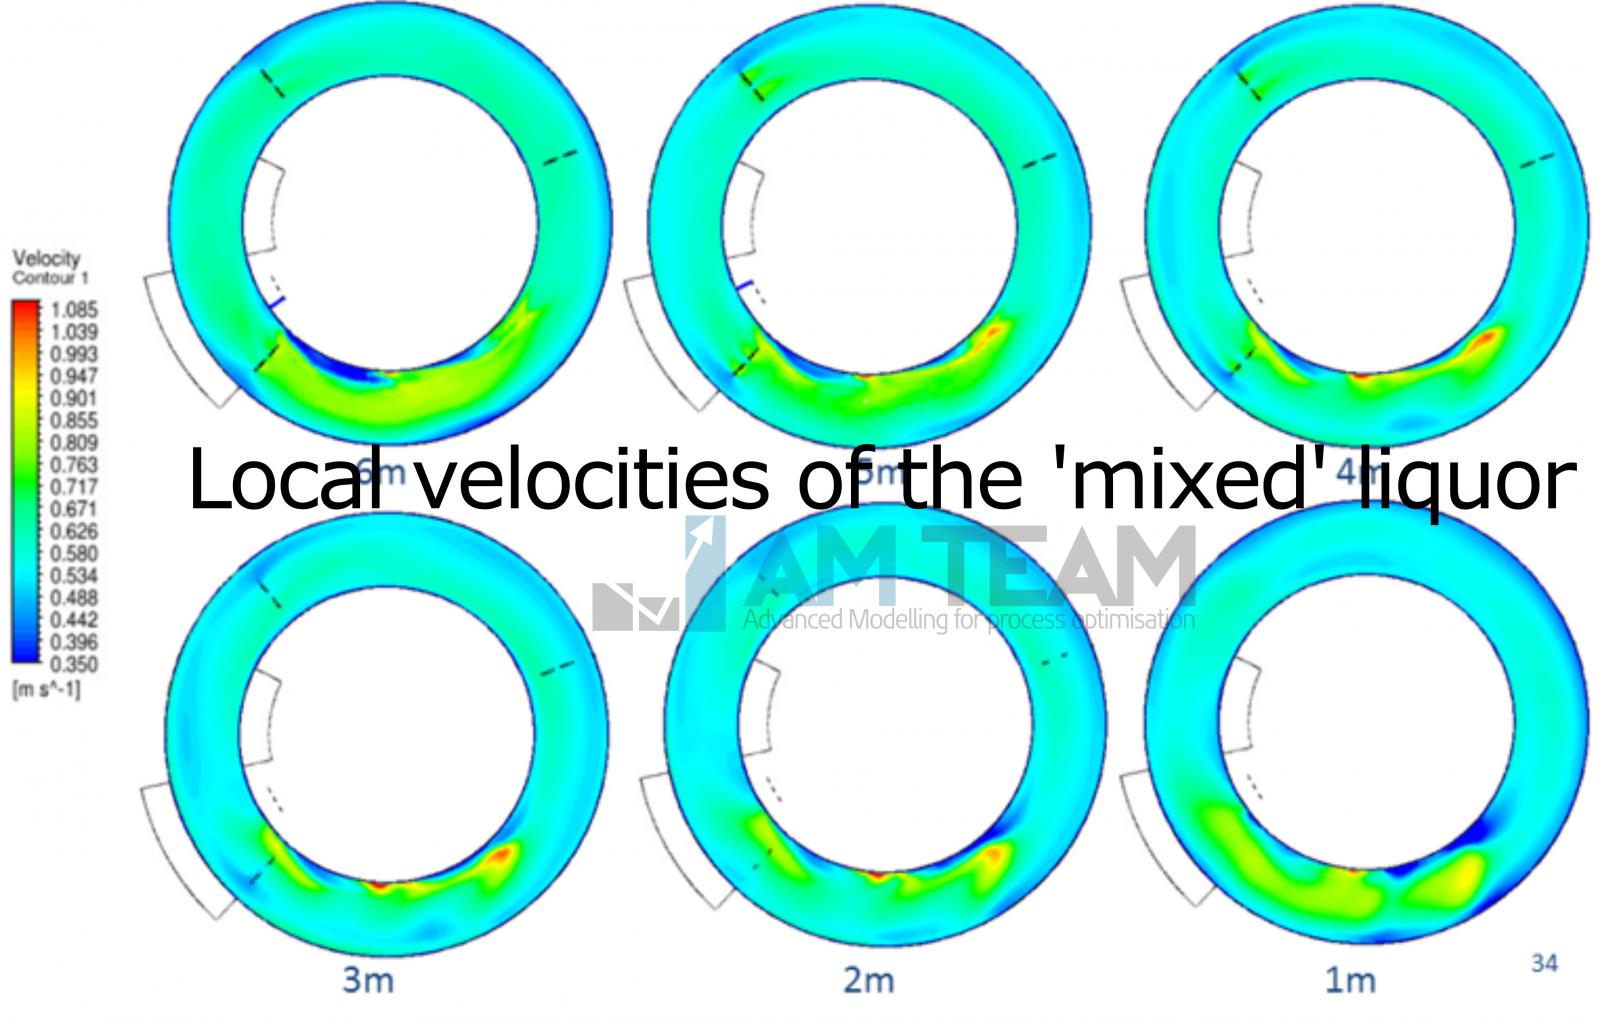
Figure 6: local velocities of the mixed liquor at different depths in the bioreactor
What is the best scenario? The following graph evaluates all scenarios at once in terms of the downstream gas holdup. (remember: downstream oxygen was causing nitrate build up in the anoxic zone during cold weather). Switching off mixers 5 and 6 at the right times (M56) could reduce the risk by 10% while saving energy. A hybrid scenario combining this with aerator reconfiguration resulted in a 20% risk reduction. This is relevant taking planned retrofits in mind.
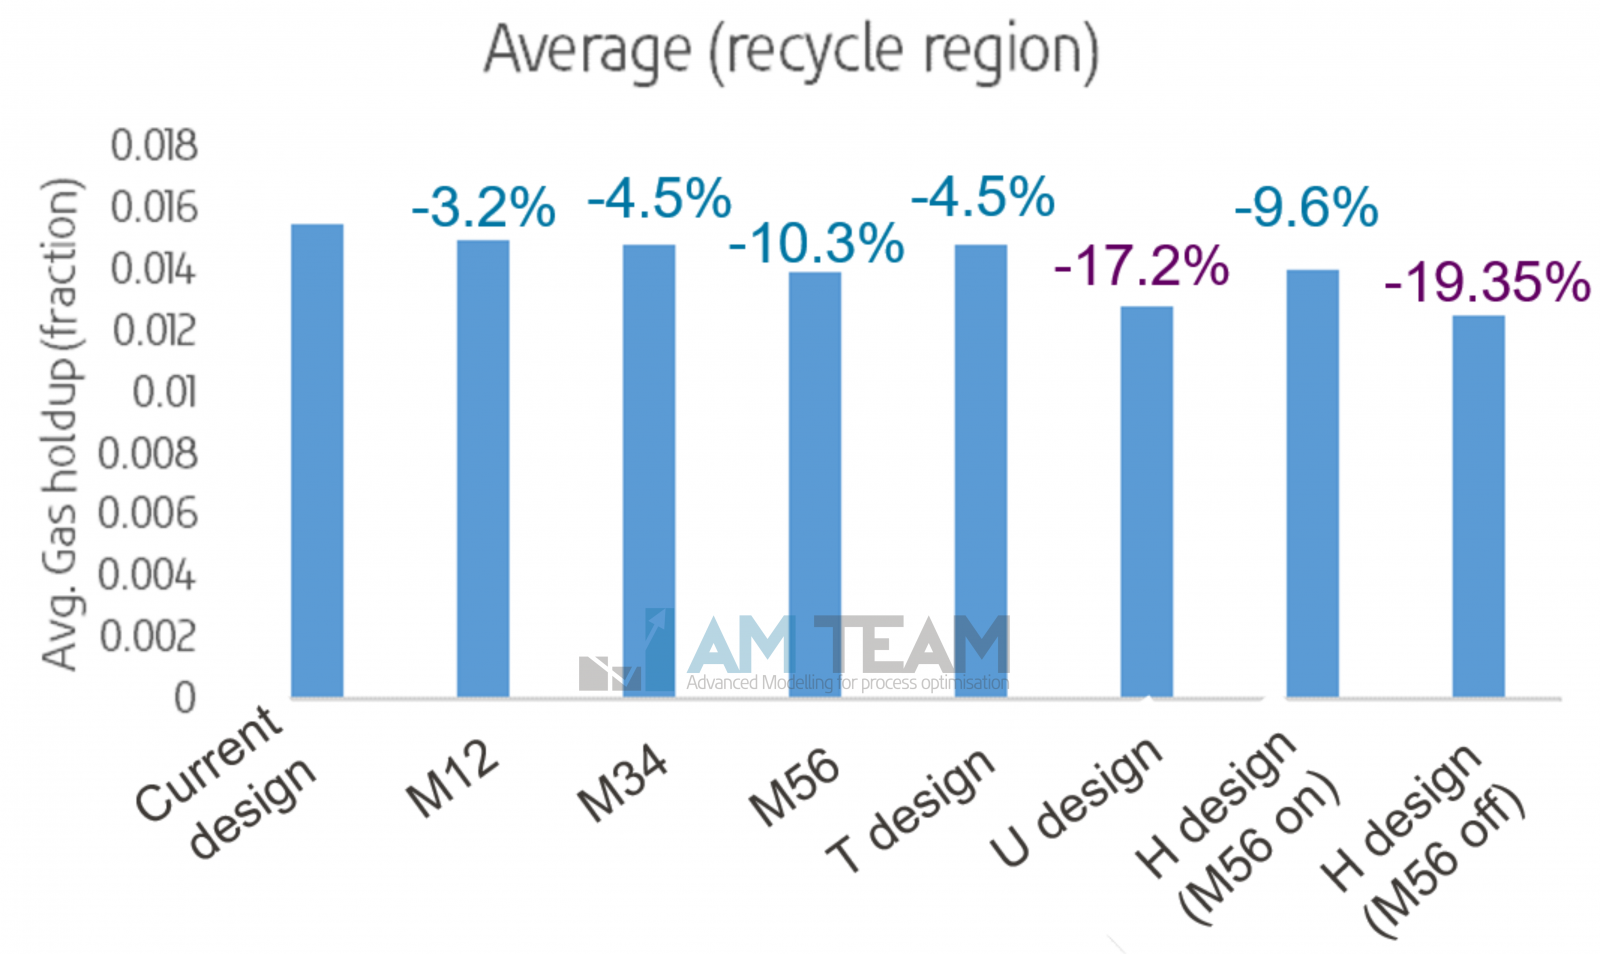
Figure 7: downstream reduction of air (gas holdup) obtained with different design and operational scenarios
4. Conclusions
- Virtual ‘what-if’ scenario testing has many benefits. It's easier, faster, less risky and offers much more testing freedom compared to real-life trials at full-scale. Mixer operation and aerator configuration can be easily assessed.
- With an accurate CFD model, you can confidently make the right decisions. This is where the real value lies. Our bioreactor model has proven accuracy (see Part I).
- Plant operators and designers benefit from understanding the interaction of mixers and bubbles, both in terms of energy savings and effluent quality.
- Minor adjustments can result in big wins. Simple measures such as switching off one or more mixers at certain flow rates can be quick wins. The model will tell you which mixers at which flow rates.
- Modelling the aeration system accurately prior to any plant design or major retrofit is highly beneficial, certainly given the investment budgets in play.
These results were presented at Weftec 2018 (New Orleans),World Water Congress 2018 (Tokyo) and in scientific publications.
There's more to discover
Eager to find out more about this project?
Want to stay up-to-date on our latest projects?
> Subscribe to our newsletter (at the bottom of this page) or follow our social media channels.
Special thanks to
- Waterboard De Dommel: Tony Flameling, Peter van Horne, Han van Happen, Victor Claessen, Stefan Weijers, Peter van Dijk
Contact us


Subscribe to our newsletter


