Practical applications of the AMOZONE engineering model
Let's talk about ozonation for water, wastewater treatment and water reuse. Yes it's an 'old technology' with first drinking water applications in France in the early 1900s. But today I would still call it an emerging technology with specific applications in the removal of trace organic contaminants (TrOCs) and (indirect) potable water reuse. Key in succesful application is handling the 'water matrix specificity' (e.g. level and type of dissolved organic carbon (DOC),...) and related 'bromate formation potential'. We think we have found a way to really revolutionize how ozonation systems are tested, designed and operated. It's an engineering simulation model that we called AMOZONE. And this is where this article is about. Keep reading. All you'll read is completely new.
The 3 engineering challenges
Figure 1 shows the typical sequence of engineering exercises and their objectives.
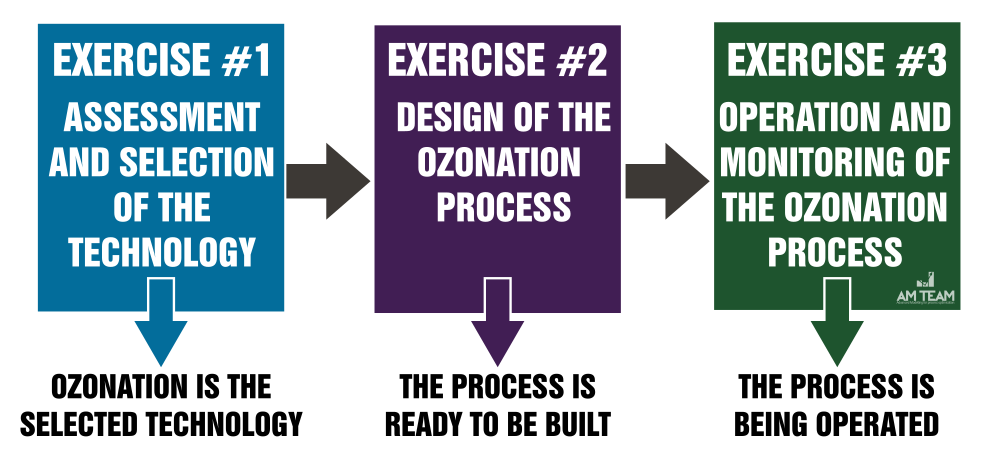
Figure 1: the 3 engineering challenges when talking about ozonation
The questions to be answered in each of the phases are very different in nature. There are multiple reasons why each of those exercises is an engineering challenge (Figure 2). But in my opinion the number one complicating factor is the matrix. With matrix I mean the specific composition of the water to be treated, both in terms of organics and inorganics, but especially the first one: the type of organics (i.e. reactivity) and their levels (e.g. 'DOC', 'COD', ...). It's that circle at the top left in Figure 2.
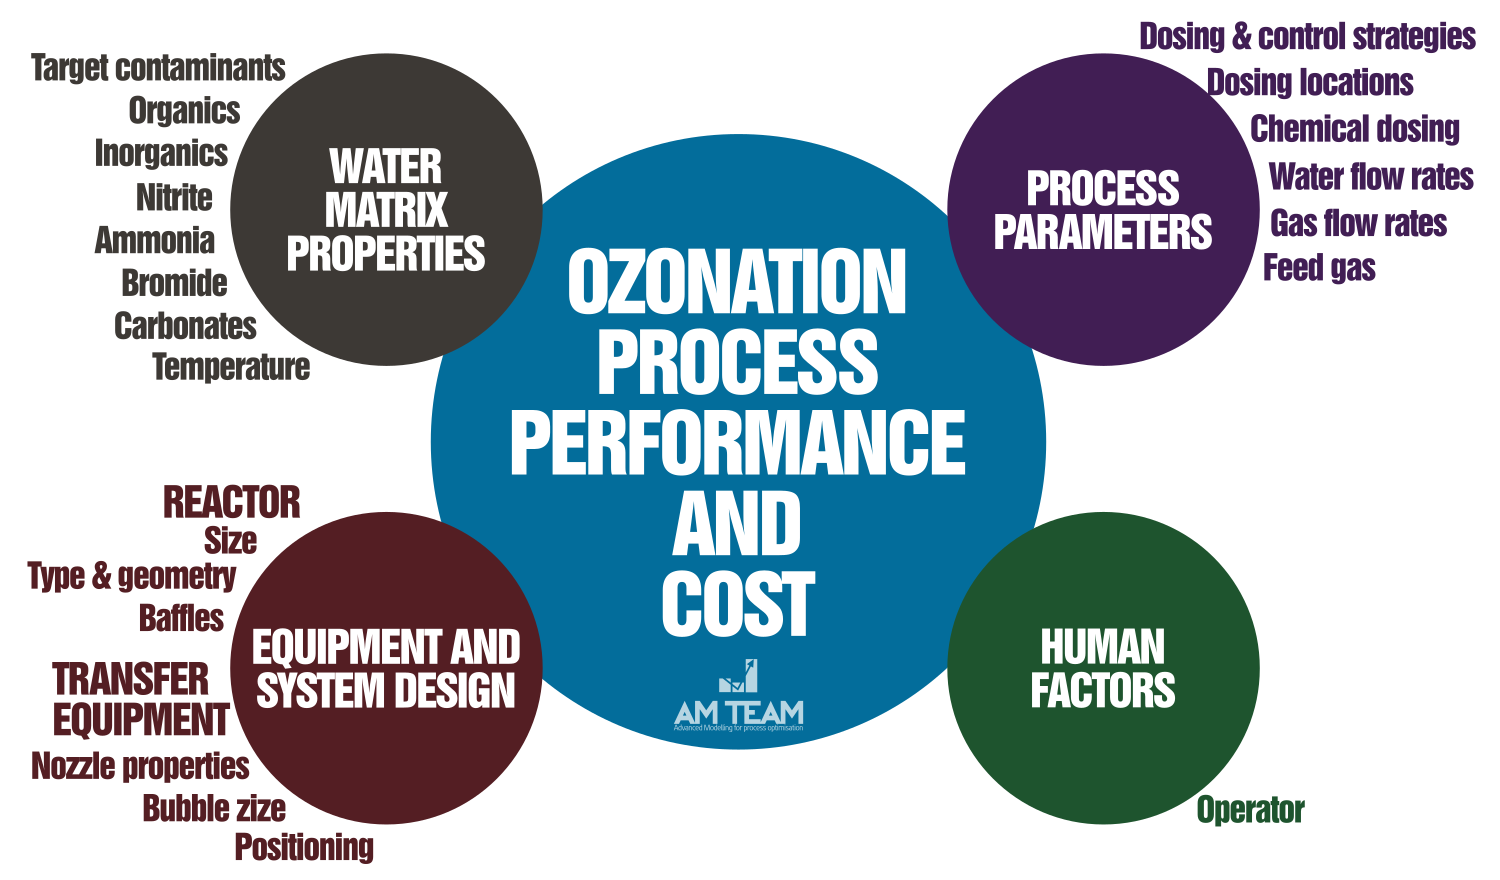
Figure 2: an overview of the factors that determine the success of ozonation. And success means performance and the cost to get to that performance.
Exercise 1: deciding to go for ozonation
In this phase, different technologies are typically compared based on multiple criteria such as cost, performance, ... These criteria include technology-specific pros and cons.
What we see happening in this stage, is that people start piloting, either on site or somewhere else. We typically see this when secondary effluent is concerned. The costs and time related to piloting are enormous. Some of the factors that contribute to the cost and time:
- Getting the hardware on site and up and running, taking safety measures into account
- The training of staff that has no experience with ozonation
- The frequent sampling and very expensive analyses (e.g. TrOCs, bromate, ...) which only provide one data point at a time
Just imagine: you have an engineering simulation model available that allows 'virtual piloting' on the computer:
- You can run as many virtual experiments as you want, changing doses, reactor volumes, flow rates, ...
- The simulation model accounts for your specific matrix
- And provides you data and information that can never be acquired with real-life piloting: for example concentration of 100 TrOCs and bromate data each minute, even for TrOCs that go below detection limit and the levels of ozone and hydroxyl radicals at any spot in your train.
Would that be valuable?
Figure 3 shows one month of bromate formation at a full-scale secondary effluent ozonation plant in the Netherlands, and the corresponding removal of 38 TrOCs for the same period. Small detail: this plant has never been built, not even one pilot. This is what we call complete virtual piloting. The TrOCs are removed to various extents by ozone and hydroxyl radicals (HO*). Also bromate is formed by both ozone and HO*. And nitrite, ammonia, pH effects are also impacting the observed fluctuations. And you can easily test bromate suppression strategies such as H2O2 addition.
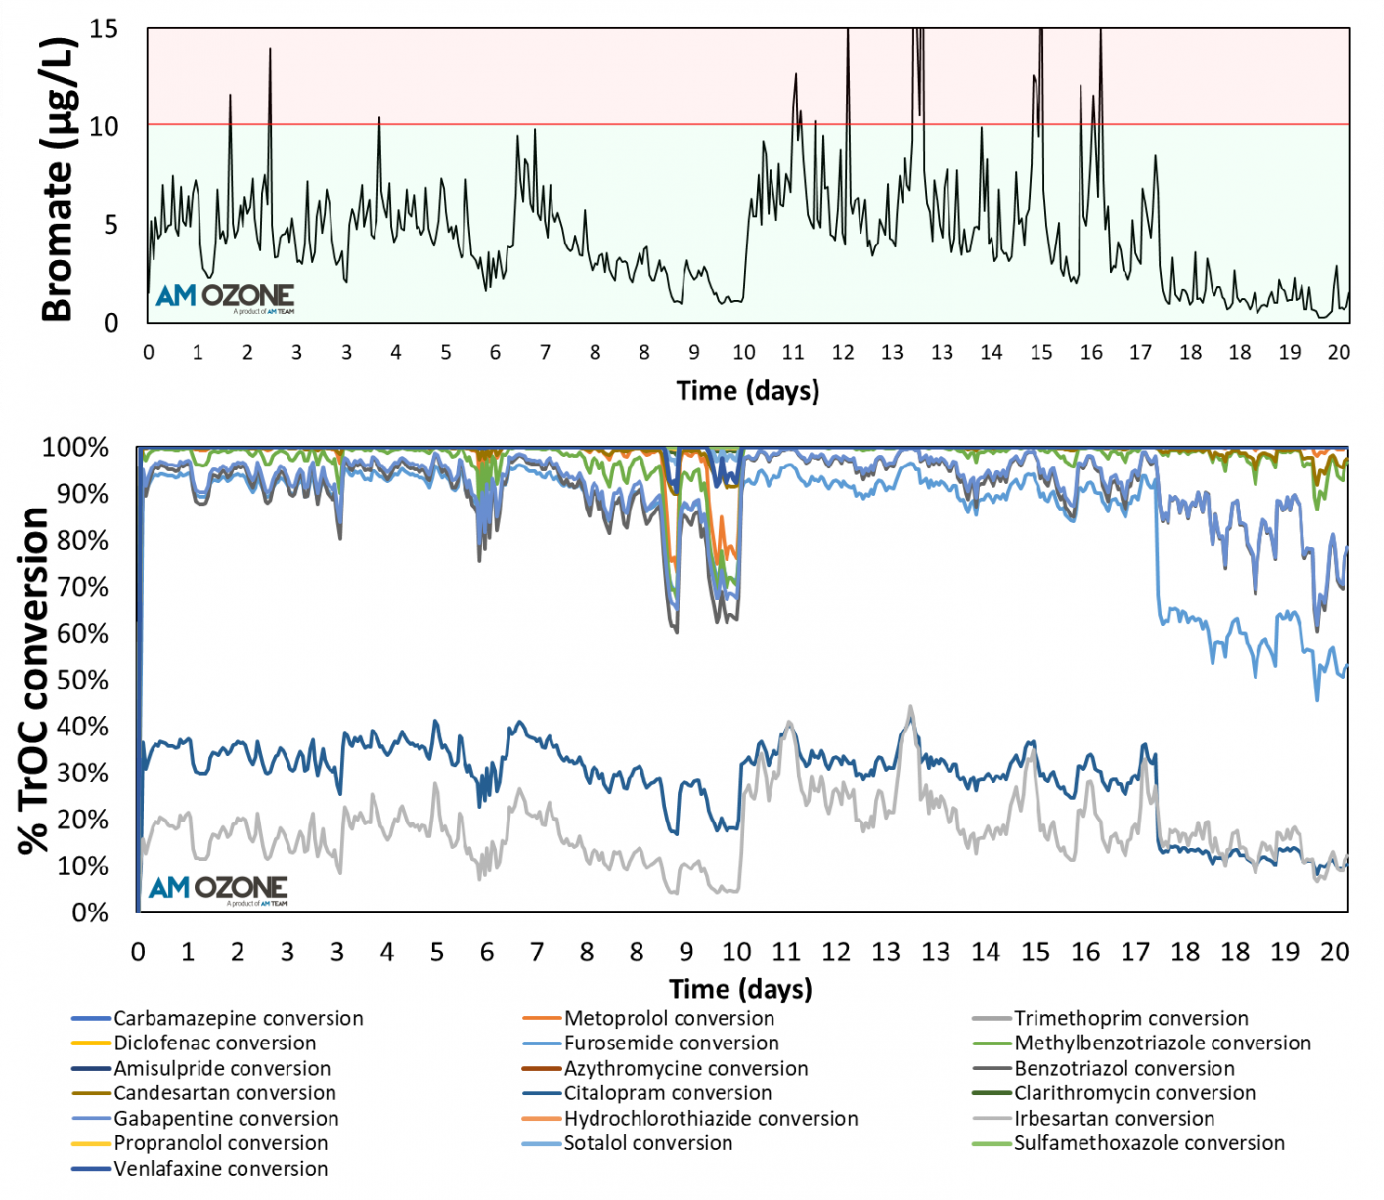
Figure 3: high resolution simulation output of bromate and 38 TrOCs at a virtual full-scale plant in the Netherlands - pay attention to how levels vary as function of flow rates and water composition, and how TrOCs are removed very differently, with their relative differences also varying throughout time (e.g. depends on the O3/HO* ratios at those moments)
I hear and understand your question: how is that possible, and didn't you need any experiments?
- Our utility customer installed some online sensors in the effluent of the real plant.
- We took 4 grab samples at the real plant over a couple of weeks and sent them to a lab for some experiments based on which we could calibrate our model
- Using the calibrated model, be built the virtual plant, fed by the sensor signals at the real plant
Exercise 2: designing the ozonation plant
Major questions include: what is the optimal sizing of the reactors, how to introduce ozone and potentially other chemicals? Which injection systems do we use? Where should sensors be installed? How will the plant react to flow rate or water quality changes? ...
Just imagine, again, you could build an unlimited amount of operational full-scale installations prior to any construction. It would kind of look like this:
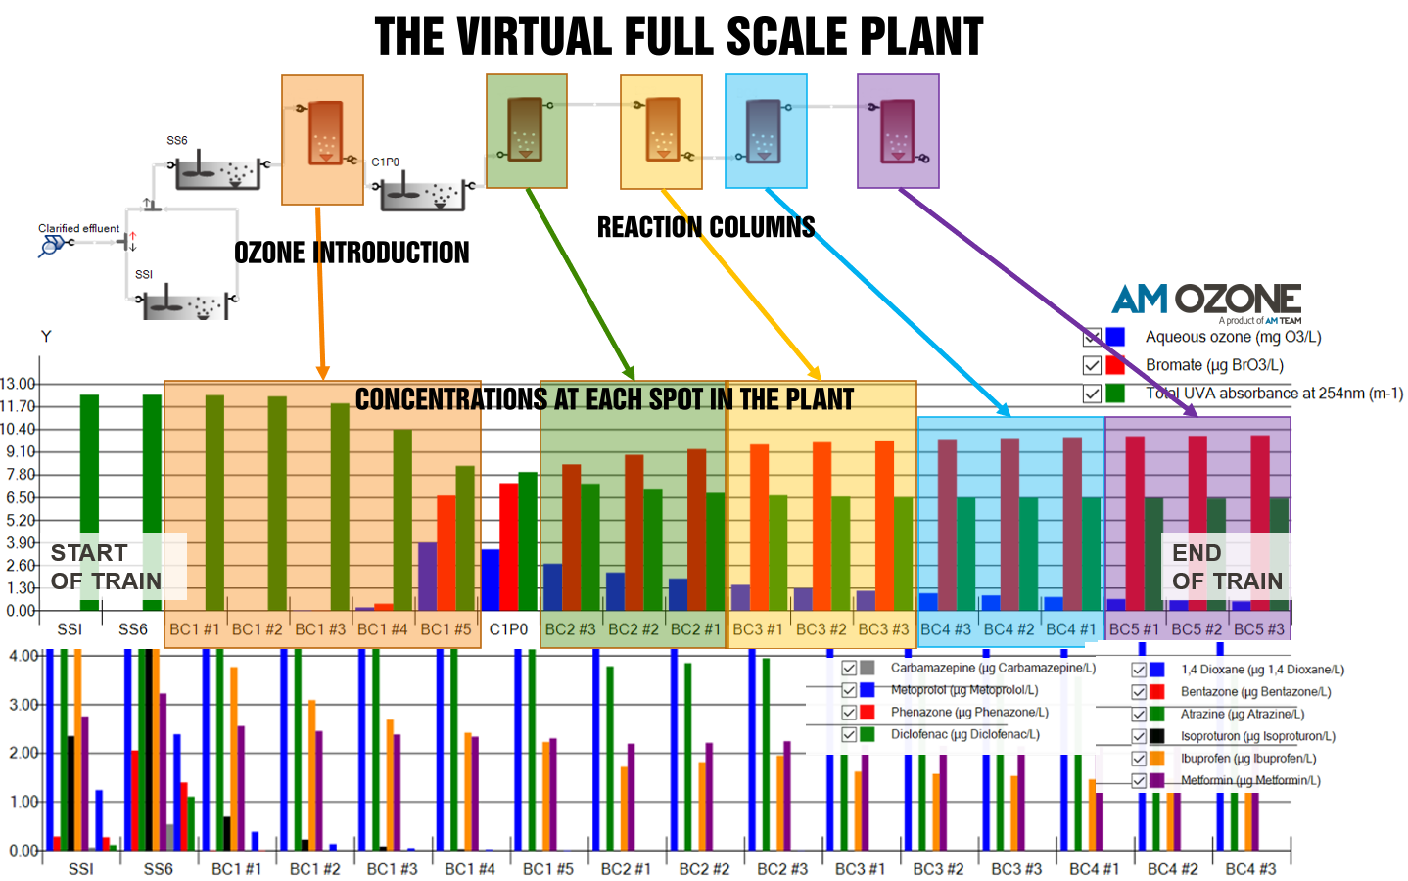
Figure 4: A virtual full scale AMOZONE plant, running in the simulation environment SUMO. At the left, water comes in. Both sidestreatm injection (SSI) and fine bubble diffusion (FBD) can be tested. The graph shows high resolution data of important variables at different virtual sampling points in the plant (including target contaminants).
Exercise 3: operating the ozonation plant
An ozonation plant is typically designed and operated for minimal bromate formation and for certain disinfection or oxidation targets. There is an issue here: not bromate, neither target contaminants or organisms can be monitored in real-time.
Just imagine, again, that you would have a simulation model predictinig what you can't measure (bromate, TrOCs, ...) based on what you can measure (pH, conductivity, UV254, ...). Here is how the result would look like:
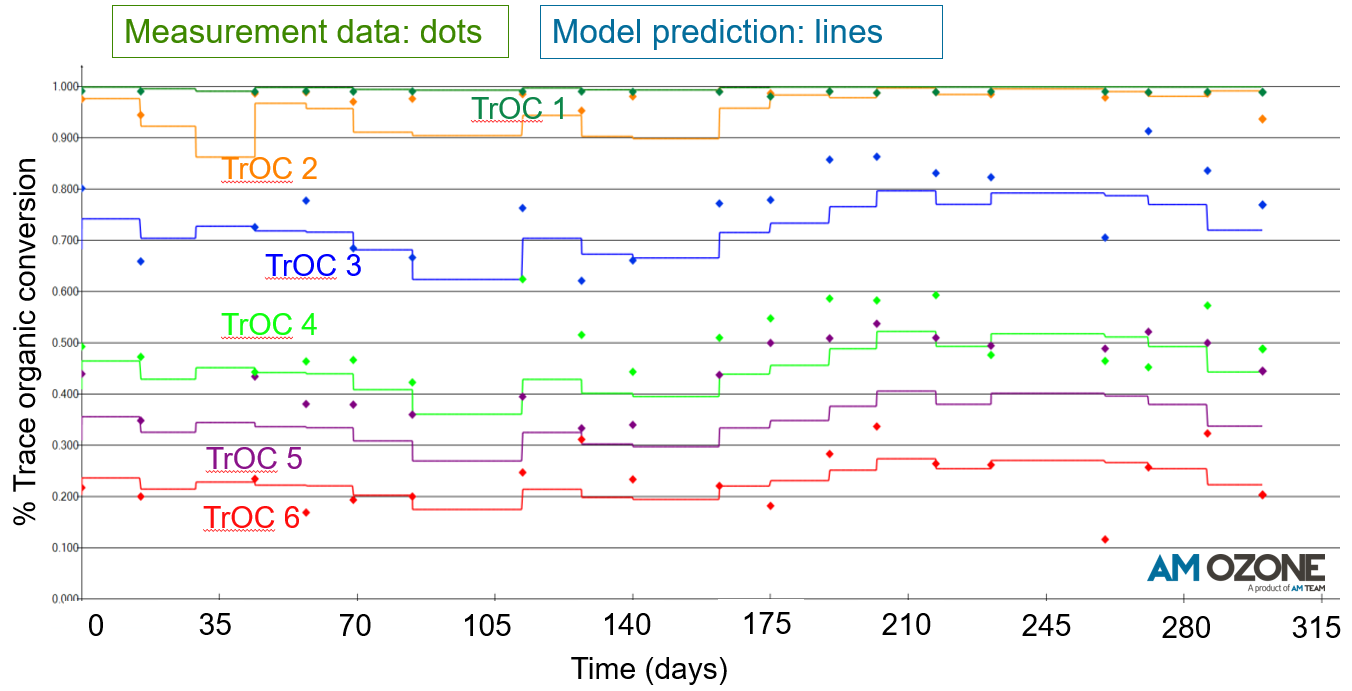
Figure 5: A true digital twin, running in parallel with the real plant, predicting the removal of 6 diffferent target contaminants. Model predictions (lines) were compared to measurement data (dots)
Another model validation, usinig secondary effluent (HRSD, US) and drinking water (Dunea, NL) is shown in Figure 6.
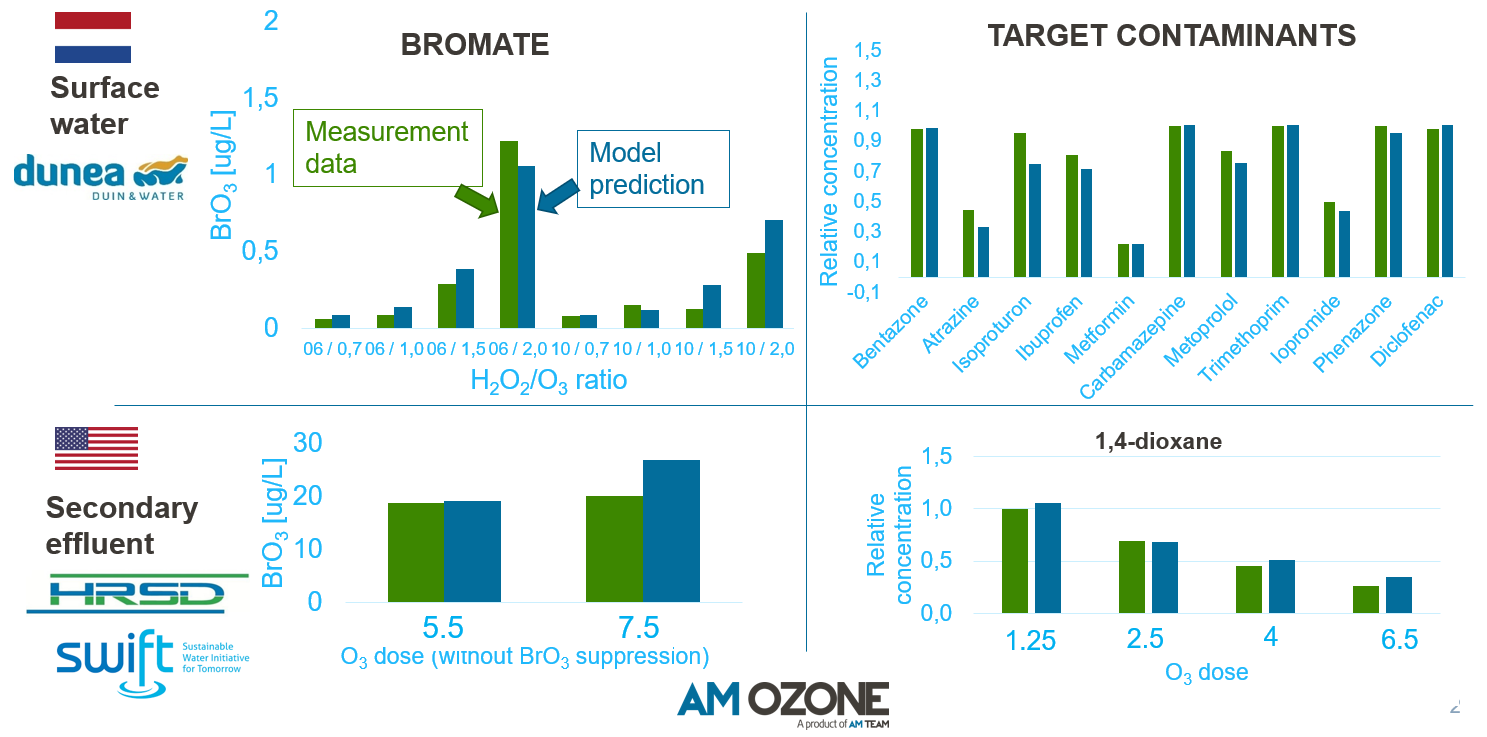
Figure 6: Comparison between real and virtual experimental runs in very different matrices
Conclusion
If you are a practitioner involved in ozononation process design or operation, this article may seem unreal. However, it is real, and we are expanding AMOZONE's application at a fast pace internationally, with very good results. If you are interested in seeing how it is being applied at multiple full-scale plants around the world, subscribe for our second AMOZONE webinar. The full recording of our first one is also available.
Acknowledgements
We did not develop this alone. I hereby thank all of our partners, colleagues and supporters.
- Hampton Roads Sanitation District (HRSD, US): the SWIFT team
- Dynamita (FR): the company behind SUMO
- Dunea (NL): the staff working at the Bergambacht plant
- Xylem (DE): the wedeco staff
- Hoogheemraadschap Hollands Noorderkwartier (HHNK) and PWN (both NL): everyone working on the new initiatives with regard to ozone application
- Tekniskaverken (SE): the people behind the Linköping plant (the first secondary effluent ozonation plant in Sweden)
- Waterschap Aa en Maas (NL): the people behind one of (if not the) the first Dutch ozonation pilots in the Netherlands
- Waterschap De Dommel (NL): the people behind the current TrOC removal initiatives and the innovation
- Vlaio: the Flemish funding agency - thanks so much for financially supporting our development efforts
- Ghent University - the Campus Kortrijk staff and other researchers that helped us with analyses and got us involved in the ongoing research projects
- Dr. Giacomo Bellandi: the only person we mention by name here, but a key driver behind all of these efforts... our ozonation modelling star
Contact us


Subscribe to our newsletter


