Unravelling the spatial secrets of N2O by combining advanced modelling tools
What you'll discover in this blog
- Reactors are not completely mixed - hotspots for N2O production can be located
- Different pathways of N2O production can coexist in one reactor zone due to strong local DO gradients
- The combination of mixing and aeration are crucial for N2O mitigation
- Integrating CFD-kinetics-N2OriskAI unravelled complex dynamics and allowed targeted N2O mitigation actions
- This integrated modelling can open a new era of reactor design/optimization
Introduction
N2O (GWP 265–298) is currently the greenhouse gas (GHG) of major concern with regards to direct emissions from Water Resource Recovery Facilities (WRRFs) and is considered the single most important ozone-depleting compound of our century. Anthropogenic activity is responsible for about 40% of the global N2O production and a 15% concentration increase has been observed since 1750. To date, 3% of the anthropogenic N2O production is identified to be coming from wastewater treatment. WRRFs designed for nutrient removal have been observed to emit up to 7% of the influent nitrogen load as gaseous N2O.
The production of N2O in bioreactors is a complex process and in the last decade, a lot of research was invested in unravelling this. One approach is to measure N2O, either in the liquid or in the off-gas. Ultimately it is needed for verification, but this is a tedious job, not in the least due to the fact that these reactors are not behaving homogeneous and local conditions can be prevailing. However, next to measuring, also mathematical modelling can be used as a powerful tool to provide more insight. These models have mostly focused on the different pathways through which N2O can be formed. However, this is also not child's play and dedicated experimental data is needed to calibrate and validate these models.
In this blog, we discuss another approach: combining CFD-coupled kinetics to traditional ASM-kinetics and linking that to a risk model that uses a knowledge base and AI for N2O risk estimation. We take a closer look at how we did this at the De Dommel WWTP of Eindhoven.
The tools: CFD-biokinetics and AI
A CFD-biokinetic model for the WWTP of Eindhoven was already developed and validated back in 2017 (Rehman et al., 2017). It gives a good description of the concentration gradients in the reactor under different influent flow rates and aeration rates (Figure 1).
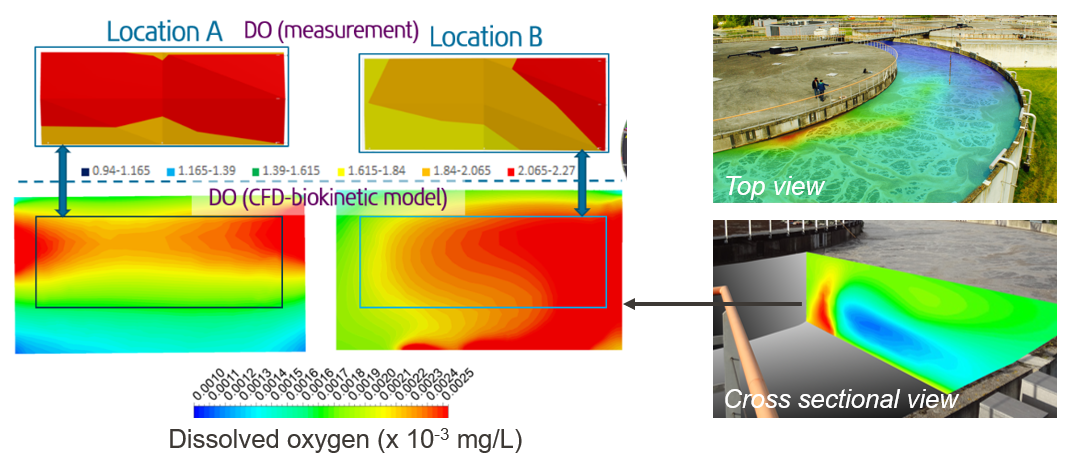
Figure 1: Measured vs simulated dissolved oxygen gradients at two spots in the reactor (left) and simulated gradients overlayed on the real reactor (right)
An N2O risk model was developed earlier by (Porro et al., 2014). It uses measured (from the SCADA) or simulated data from an ASM-type model of a system as inputs (DO, NO2-, pH, COD/N). An AI Expert/fuzzy-logic system then uses that information and converts it into a risk for N2O production. Moreover, it also allows suggesting a mitigation strategy. Full-scale application of the model has resulted in total GHG emission reductions of 40-70%.
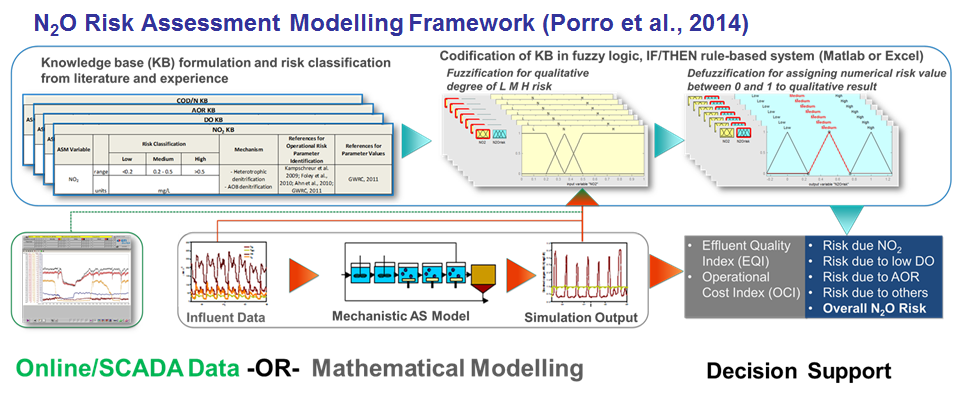
Figure 2: The N2O risk model is fed by either measured or simulated data. The AI model predicts N2O risk and suggests possible mitigation measures.
Study subject: WRRF of Eindhoven
We studied the WRRF of Eindhoven, operated by the innovative utility Waterboard De Dommel (the Netherlands). It has a modified-UCT configuration where the outer ring is an aerobic-anoxic zone for nitrification and denitrification (Figure 3). This zone was the object of study here.
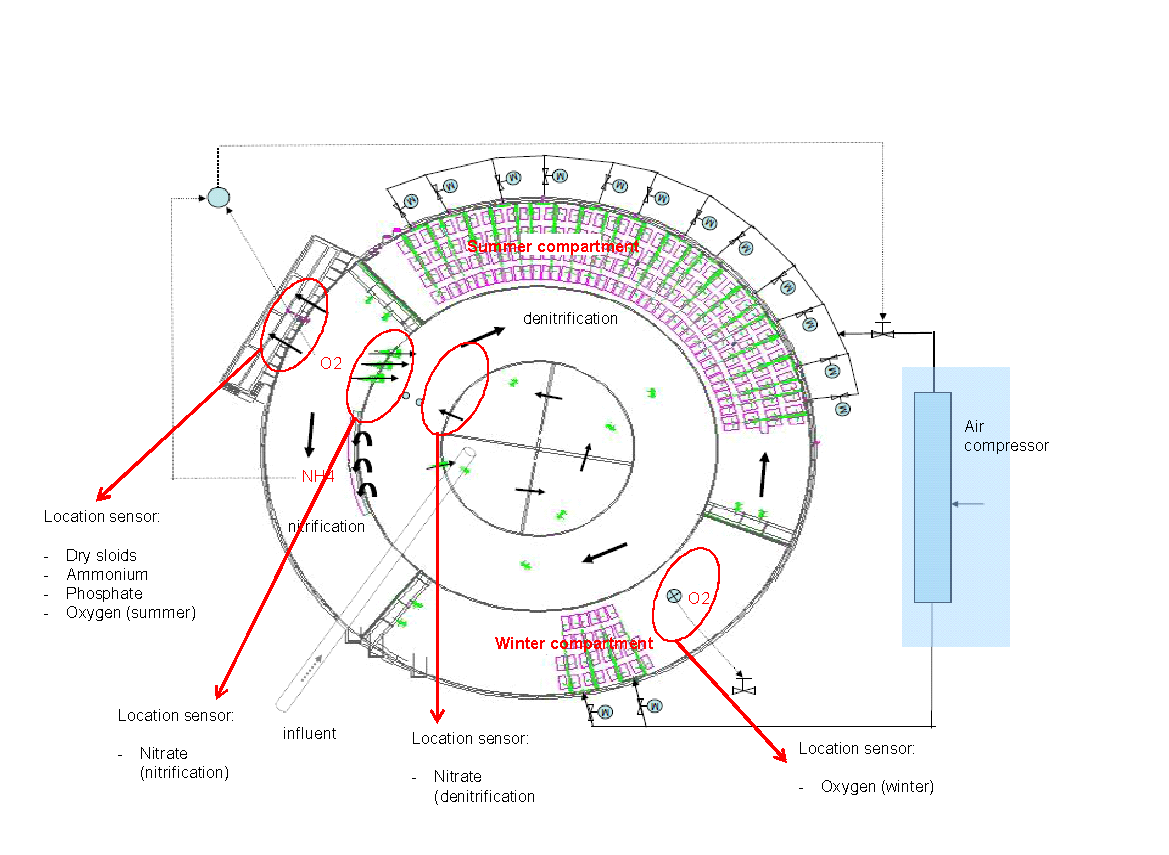
Figure 3: The Eindhoven WRRF has three identical circular bioreactors with an aerated outer ring, anoxic middle ring and anaerobic inner ring
The combi: CFD-biokinetic-N2O risk
For the first time, we combined the CFD-biokinetic simulation results with an N2O risk model (Figure 4). The 3D dissolved oxygen data from the biokinetic CFD model were fed to the N2O risk model, providing a good idea of what's happening N2O wise in the reactor, based on the actual mixing.
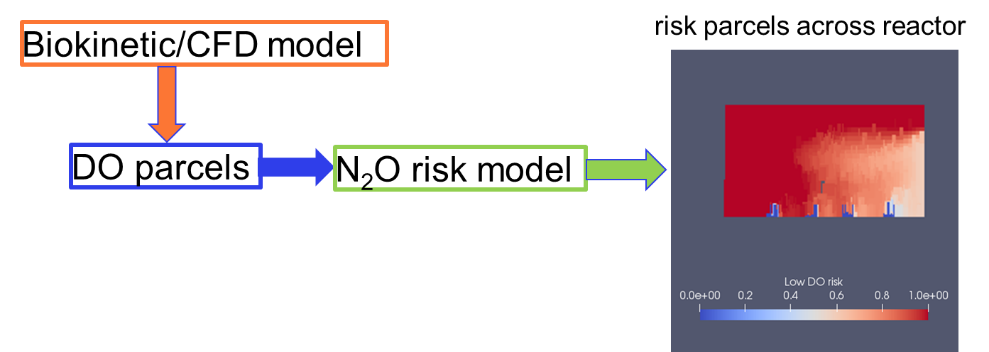
Figure 4: The coupling of a CFD-biokinetic model with the N2O risk model, providing unprecedented 3D insights on N2O risk
This model was used for scenario analysis to optimize the bioreactor. One can search for an optimal diffuser design without affecting process performance (CFD-biokinetic model) and verify the implications/risk for N2O emissions (via the risk model).
Both under high and low DO conditions, N2O can be produced. The pathway depends on the condition: either 'low DO' or 'high DO'. To investigate both paths, we tested two different scenarios.
Table 1: Scenarios to capture the N2O risk at both low and high DO conditions
Condition
The major cause of N2O
Low-load/low flow
Ammonia peak first begins due to low DO. We run low DO until ammonia reaches a specific concentration and when flow picks up.
High-load/high flow
Ammonia peaking and high DO from ammonia-based aeration control.
N2O risk at low DO in aerated zone
For the low load/flow condition, we see that a lot of the summer aeration package has a high risk of N2O emissions (dark red colour) due to low DO (low DO risk),while the risk reduces with the direction of flow from (Figure 5a). The lowest N2O risk was observed near the end of the summer package. This supports what we have already seen during previous N2O measurement campaigns: higher N2O emissions were measured at the beginning of the summer package compared to what was observed at the end of that aeration zone.
For the high load/flow condition, we see less low DO risk in general (Figure 5b),obviously because we are aerating more. So this tells us that for both conditions, we can have N2O produced from low DO (nitrifier denitrification).
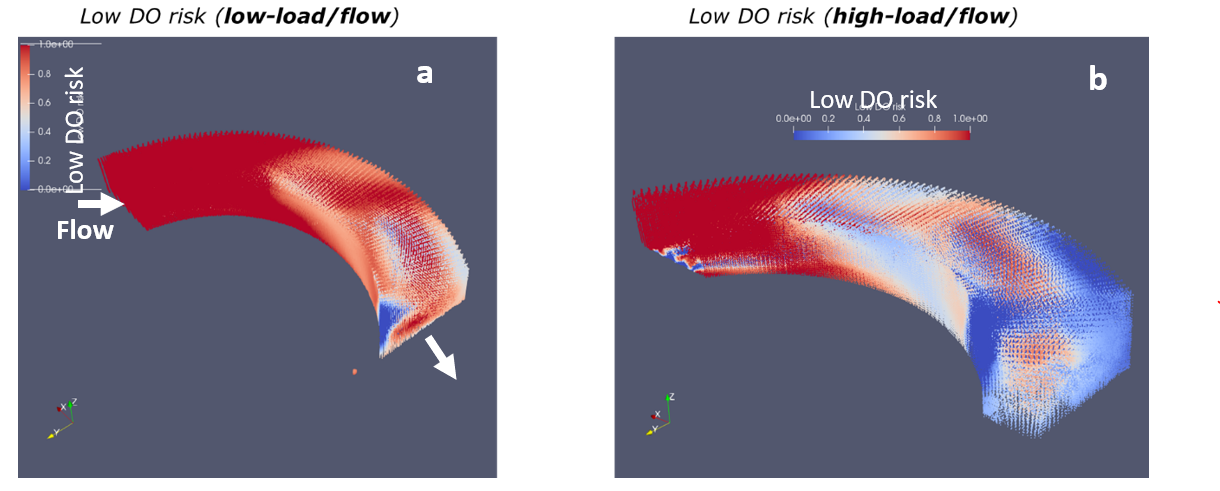
Figure 5: The N2O risk at low DO conditions is higher for low load/flow (a) compared to high load/flow (b) – the 3D image shows a slice of the outer bioreactor ring
N2O risk at high DO in aerated zone
For the low load/flow condition, we see that the summer package has minimal risk due to high DO (Figure 6a). However, for the high load/flow condition, we see one area with red a high High DO risk at the beginning of the summer package and one larger area at the end (Figure 6b). We saw in the previous section that there was also a high low DO risk at the beginning. This confirms the possibility of N2O being produced not only from a high DO, but also from low DO conditions, so from both AOB pathways.
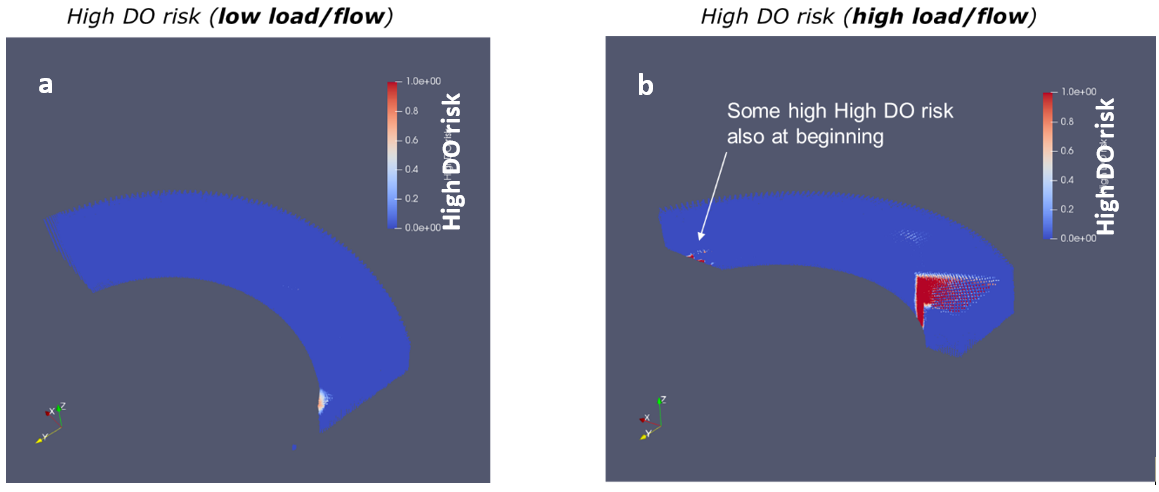
Figure 6: The N2O risk at high DO conditions is lower for low load/flow (a) compared to high load/flow (b) – the 3D image shows a slice of the outer bioreactor ring
N2O risk in Anoxic zone
For both low load/flow and high load/flow conditions, we see that most of the anoxic zone is under high risk (from heterotrophic denitrification pathway),which starts when DO starts to go above 0.1 mg/L (Figure 7). As expected, we see more high risk propagate through the anoxic zone under the high load/high flow condition because of higher flows in the outer ring and higher aeration and DO recirculated from the upstream aerobic zone where the summer package is. So we can see how controlling DO not to make it go as high as it usually does will help mitigate N2O production in the aerobic zone and in the anoxic zone.
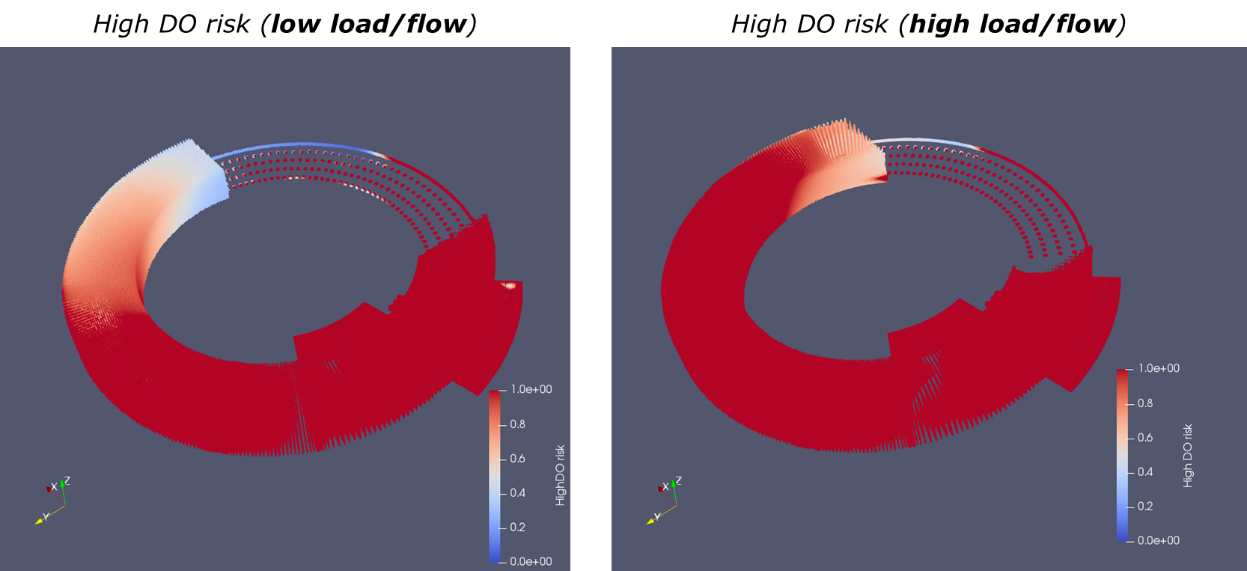
Figure 7: Both at low load/flow (a) and high load/flow (b) conditions, the N2O risk is high – the responsible pathway is high DO (>0.1 mg/L)
The takeaways
- Because the reactor is not completely mixed, we see that there is the potential for N2O production from low DO conditions even during conditions when DO is kept high per the DO sensor in ammonia-based DO control.
- When mitigating N2O by reducing High DO risk at the Eindhoven WRRF, the new DO setpoints need to be picked carefully as such that low DO does not dominate, increasing the low DO related to the N2O formation risk.
- N2O prediction to get an idea of emissions from different alternatives can easily be added with N2O in an ASM model structure or via Machine Learning. The method described in this article was picked to gain insights into mitigation strategies that are not provided by N2O emission predictions.
- This advanced modelling approach provided greater insights and led to a better understanding of how hydrodynamics from different design alternatives can potentially impact N2O production/mitigation and predictions of N2O risk and the importance of sensor location/placement.
References
Porro, J., Milleri, C., Comas, J., Rodriguez-Roda, I., Pijuan, M., Corominas, L., Guo, L.S., Daelman, M.R.J., Volcke, E.I.P., van Loosdrecht, M.C.M., Vanrolleghem, P.A., Nopens, I., 2014. Risk assessment modelling of nitrous oxide in activated sludge systems: Quality not Quantity., in: 4th IWA/WEF Wastewater Treatment Modelling Seminar, WWTmod 2014. Spa, Belgium.
Rehman, U., Audenaert, W., Amerlinck, Y., Maere, T., Arnaldos, M., Nopens, I., 2017. How well-mixed is well mixed? Hydrodynamic-biokinetic model integration in an aerated tank of a full-scale water resource recovery facility. Water Sci. Technol. 76, 1950–1965. https://doi.org/10.2166/wst.2017.330
The team
J. Porro (Cobalt Water Global),U. Rehman (AM-Team),T. Flameling (formerly at Waterboard De Dommel),G. Bellandi (AM-Team),A. Deeke (Waterboard De Dommel),W. Audenaert (AM-Team),S. Weijers (Waterboard De Dommel) and I. Nopens (AM-Team & CobaltWater Global)


.png)
Subscribe to our newsletter


